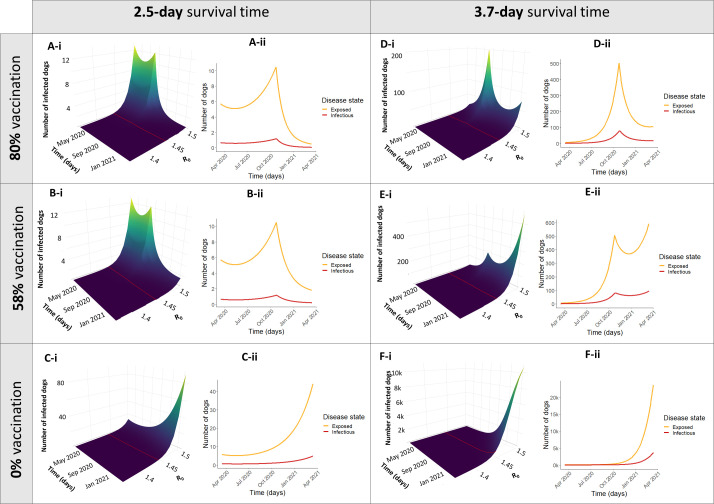
Fig 2. Different simulations of disruption scenarios for 1 year.
Simulations depict daily point prevalence of each disease state (S,E,I,V). Simulations were run for 1 year after the beginning of COVID-19 control measures in Arequipa, Peru (March 16, 2020- March 16, 2021). Panels A-C depict different vaccination scenarios with normal levels of surveillance and control measures leading to an average survival time (ST) of rabid dogs to be 2.5 days. Panels D-F show the same vaccination scenarios with decreased surveillance leading to an increased survival time of rabid dogs to 3.7 days. The vaccination scenarios depicted correspond to yearly vaccination campaigns reaching the optimal goal of 80% coverage (Panels A, D), a sub-optimal level of 58% coverage (Panels B, E), and a complete cancellation of the vaccination campaign where coverage is 0% (Panels C, F). Both the surface plots with a range of values of R0 (i) and a transect where R0 = 1.44 (ii) are displayed).

