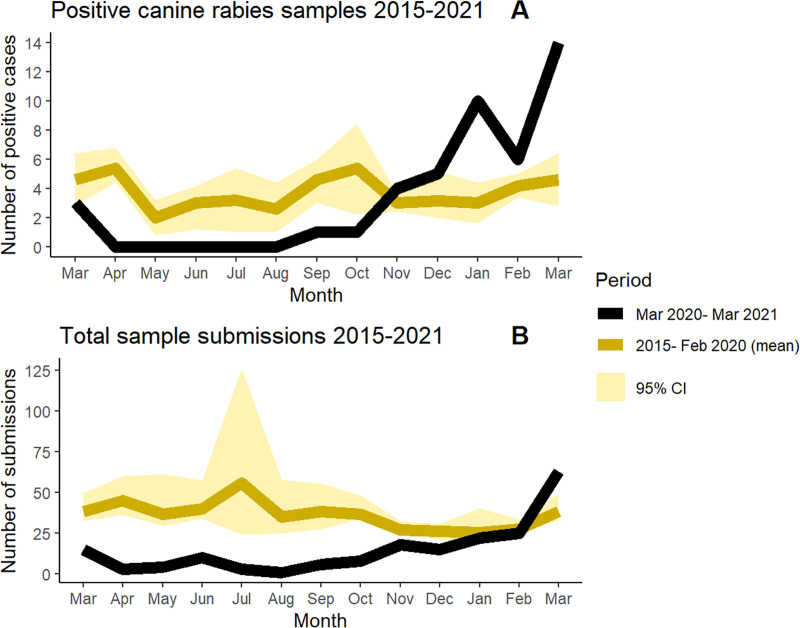
Fig 3. Canine rabies diagnostic samples submitted from 2015–2021.
Averages for monthly canine rabies case counts (monthly cumulative incidence) confirmed by laboratory diagnosis (Panel A) and for total canine diagnostic sample submissions to the Peru Ministry of Health for Arequipa Department (Panel B) were calculated by aggregating monthly data from March 2015 (when rabies was first reported in Arequipa city) to February 2020 (the last month that Peru was operating under non-COVID conditions) and compared to pandemic time surveillance data (March 2020 to March 2021). 95% confidence intervals were computed via bootstrap methods by resampling 2000 times. A full timeline is available in the supplementary information (Figure C in S2 Appendix).

