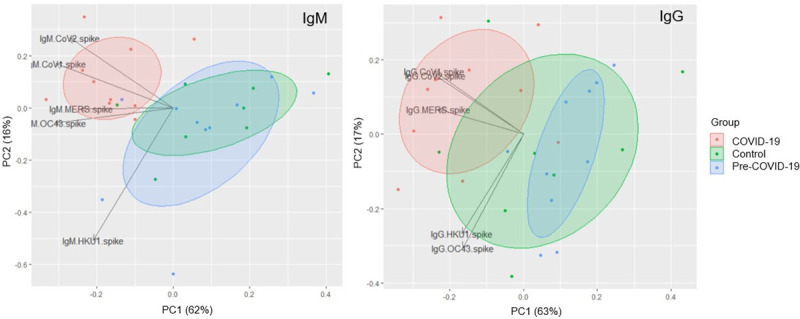
Fig 2. PCA plot of IgM and IgG pan-CoV responses.

PCA plot showing IgM (left) and IgG (right) responses to spike proteins for SARS-CoV-2, SARS-CoV-1, MERS-CoV, OC43, and HKU1 for COVID-19 (red), Control (green), and pre-COVID (blue) samples. Each data point reflects a single sample colored by group; loading vectors reflecting the direction of the contribution of each parameter to the PCA plot is shown. Ellipses denote the 50% confidence interval for each group.
