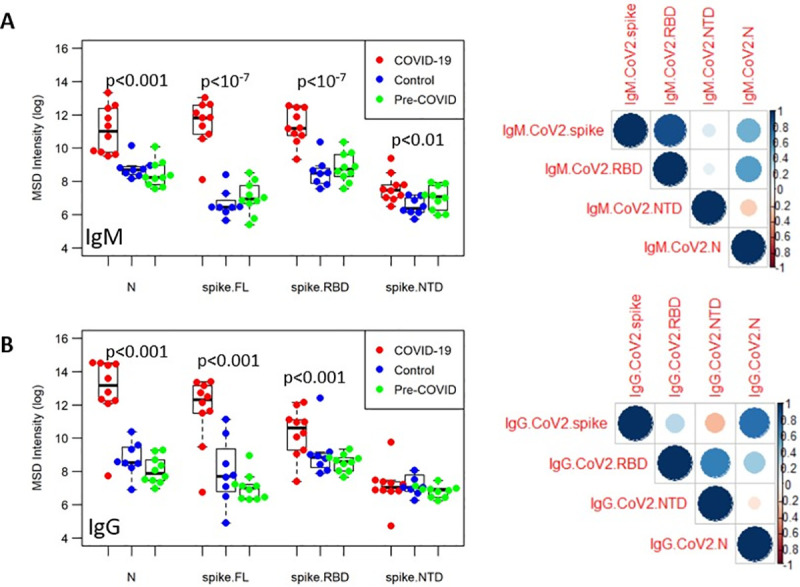
Fig 4. Fine-specificity of SARS-CoV-2 specific antibody responses.

The IgM (A) and IgG (B) responses in samples from three groups (COVID-19, red; Control, blue; Pre-COVID, green) was assessed in the multiplex ECLIA platform against SARS-CoV-2 full-length spike protein, spike RBD, spike NTD, and nucleocapsid. Correlation matrices are shown on the right, with the color and size of the circles corresponding to pairwise Pearson correlation coefficient.
