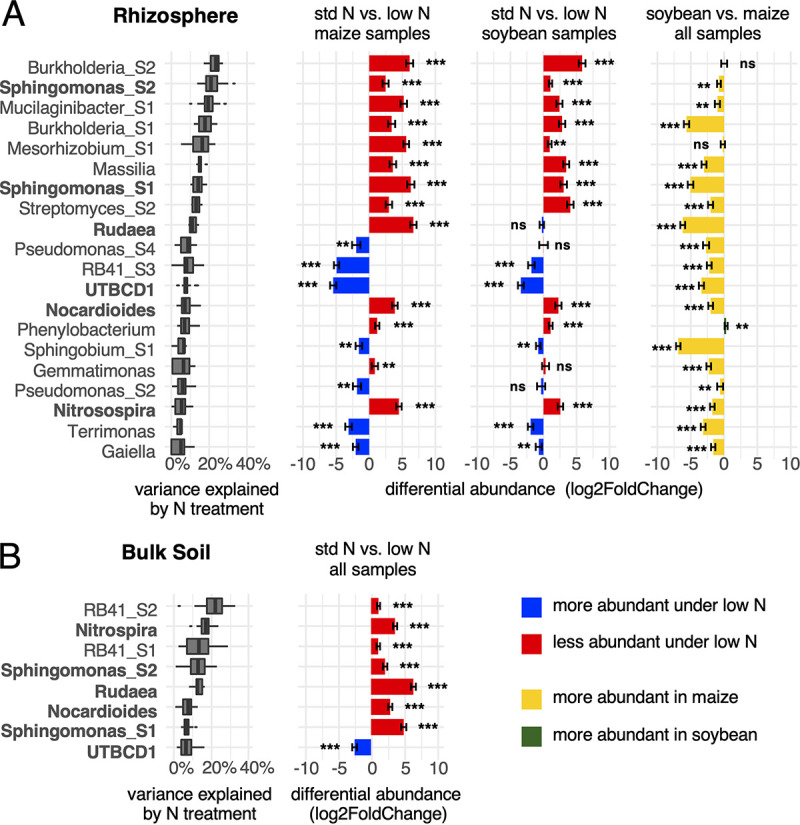
FIG 5.

Microbial groups respond to N treatment in rhizospheres of either plant species and in bulk soil. Taxonomic groups at the genus and subgenus levels were ranked by the fraction of total variance explained by N treatment in the rhizosphere (A) and in bulk soil (B). Groups with a median variance score >5% are shown. Differential abundance of groups, log2 (abundance under std N/abundance under low N), was calculated pairwise for 48 maize and 48 soybean rhizosphere samples and for 96 bulk soil samples using DESeq2. For comparison, differential abundance in soybean versus maize in rhizosphere (green/yellow bars) is shown. Bars show standard errors, and asterisks indicate significantly different abundance between std N and low N at FDR-adjusted P values of <0.01 (***) and <0.05 (**). Taxa that showed response to N treatment in both rhizosphere and bulk soil are shown in bold.
