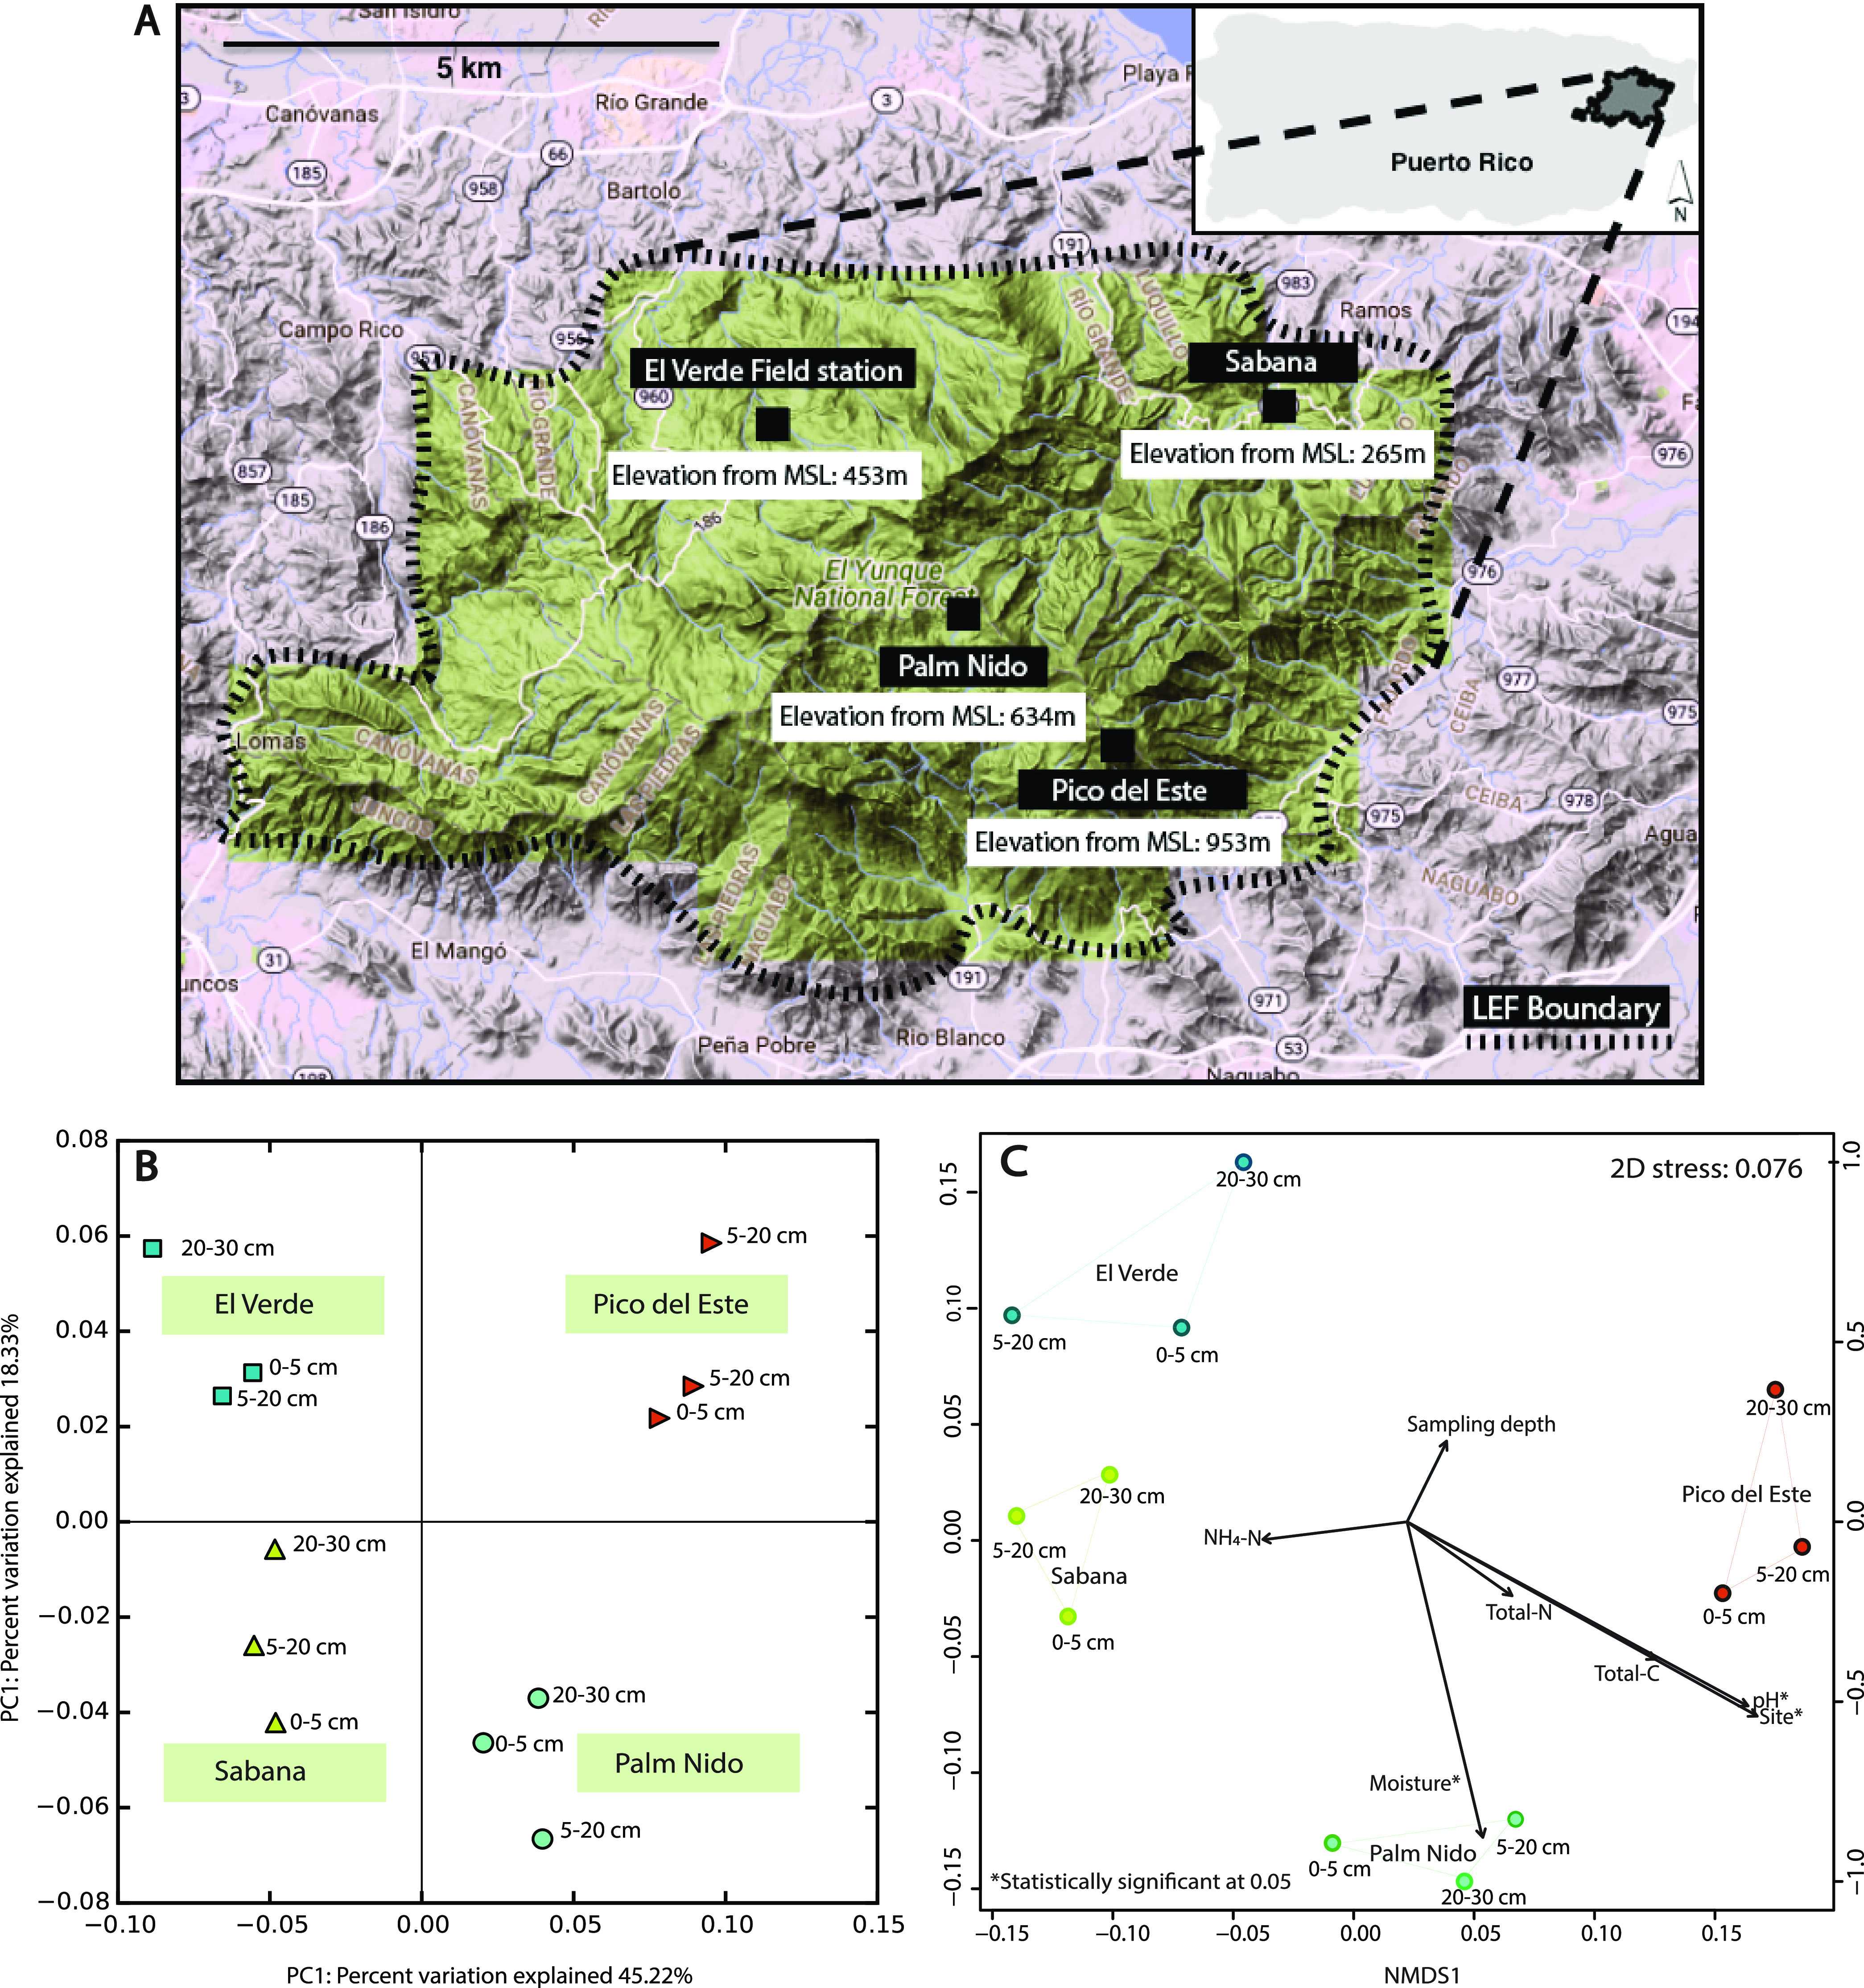
FIG 1.

Sampling location map and microbial community diversity among the study sites. (A) Map of the four sampling sites within the Luquillo Experimental Forest (LEF). (B) Principal coordinate analysis (PCoA) plots based on Mash distances, colored by sampling site. (C) Nonmetric multidimensional scaling (NMDS) plot with the soil physicochemical parameters incorporated. The arrow lengths are proportional to the strength of the correlations obtained between measured soil physicochemical parameters and each ordination axis. The coordinates for the Luquillo Experimental Forest (LEF) were obtained from DEIMS-SDR (Dynamic Ecological Information Management System, site and dataset registry; https://deims.org/bd0b5bcf-4f2e-4038-8275-629ffa5bf2aa) and visualized using the terrain feature in Google Maps. The map was refined and annotated in Adobe Illustrator.
