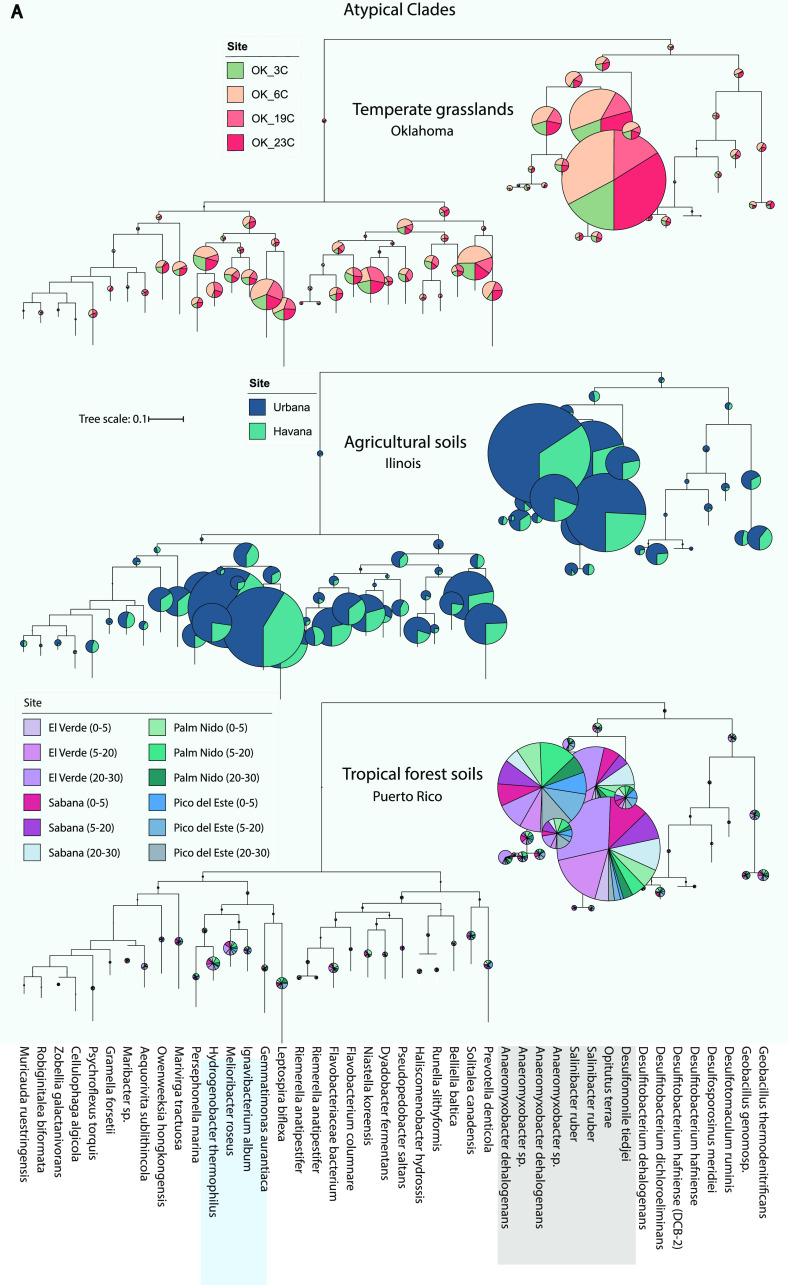
FIG 3.
Phylogenetic diversity of nosZ-carrying metagenomic reads recovered in each soil ecosystem. nosZ sequences were identified by the ROCker pipeline and placed in a reference nosZ phylogeny as described in Materials and Methods. The radii of the pie charts are proportional to the number of reads assigned to each subclade and the colors represent the sampling sites from each ecosystem (see figure key). Subclades highlighted in gray indicate the most abundant subclades across all three ecosystems, whereas the ones highlighted in blue were abundant only in agricultural soils (IL). (A) nosZ reads from every sampling site recruiting to clade II clades. (B) nosZ reads recruiting to clade I clades. Inset shows the most abundant subclade (Opitutus terrae) from panel A and its distribution across all sites. Note that in all three ecosystems most of the reads recruit to clade II subclades. Fig. S7 shows the distribution of the reads among the most abundant subclades in detail.

