
Figure 3: Pump flow rate analysis at different actuator speeds.
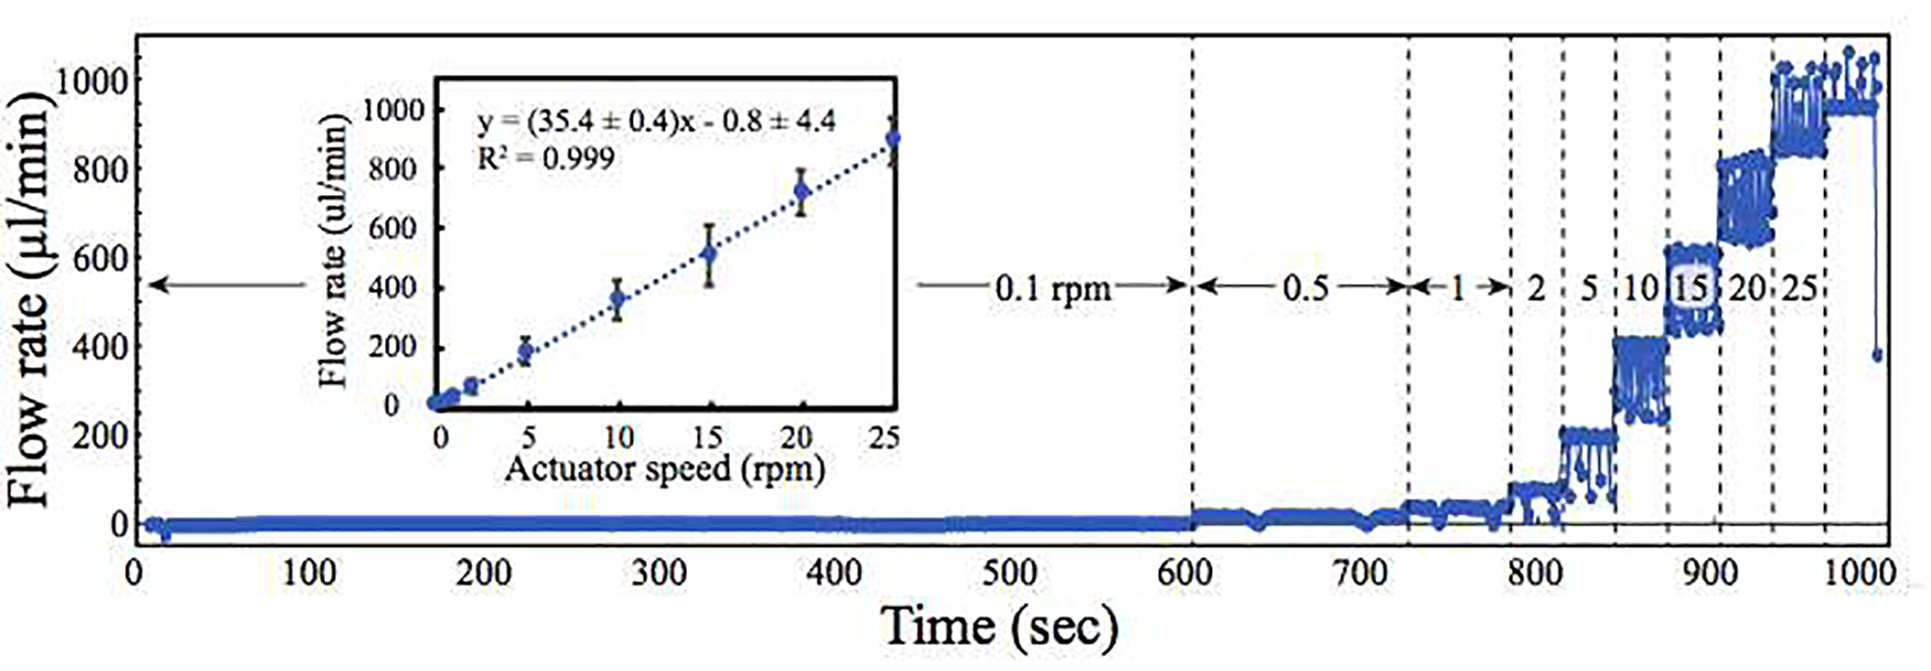
Flow rate vs. time plot showing an increase in flow rate with increasing actuator speed. For each speed tested (0.1, 0.5, 1, 2, 5, 10, 15, 20, and 25 rpm), the flow rate was monitored using a flow sensor for at least one actuator revolution. Transient decreases in flow rate are seen when the actuator roller departed from the channel. At speeds above 25 rpm (far right), the flow exceeded the dynamic range of the sensor, which was no longer able to measure flow accurately. Inset. Plot of average flow rate vs. actuator speed showing a linear increase in flow rate with increasing pump speed. Data are presented as means and standard deviations. All experiments were conducted under ambient conditions.