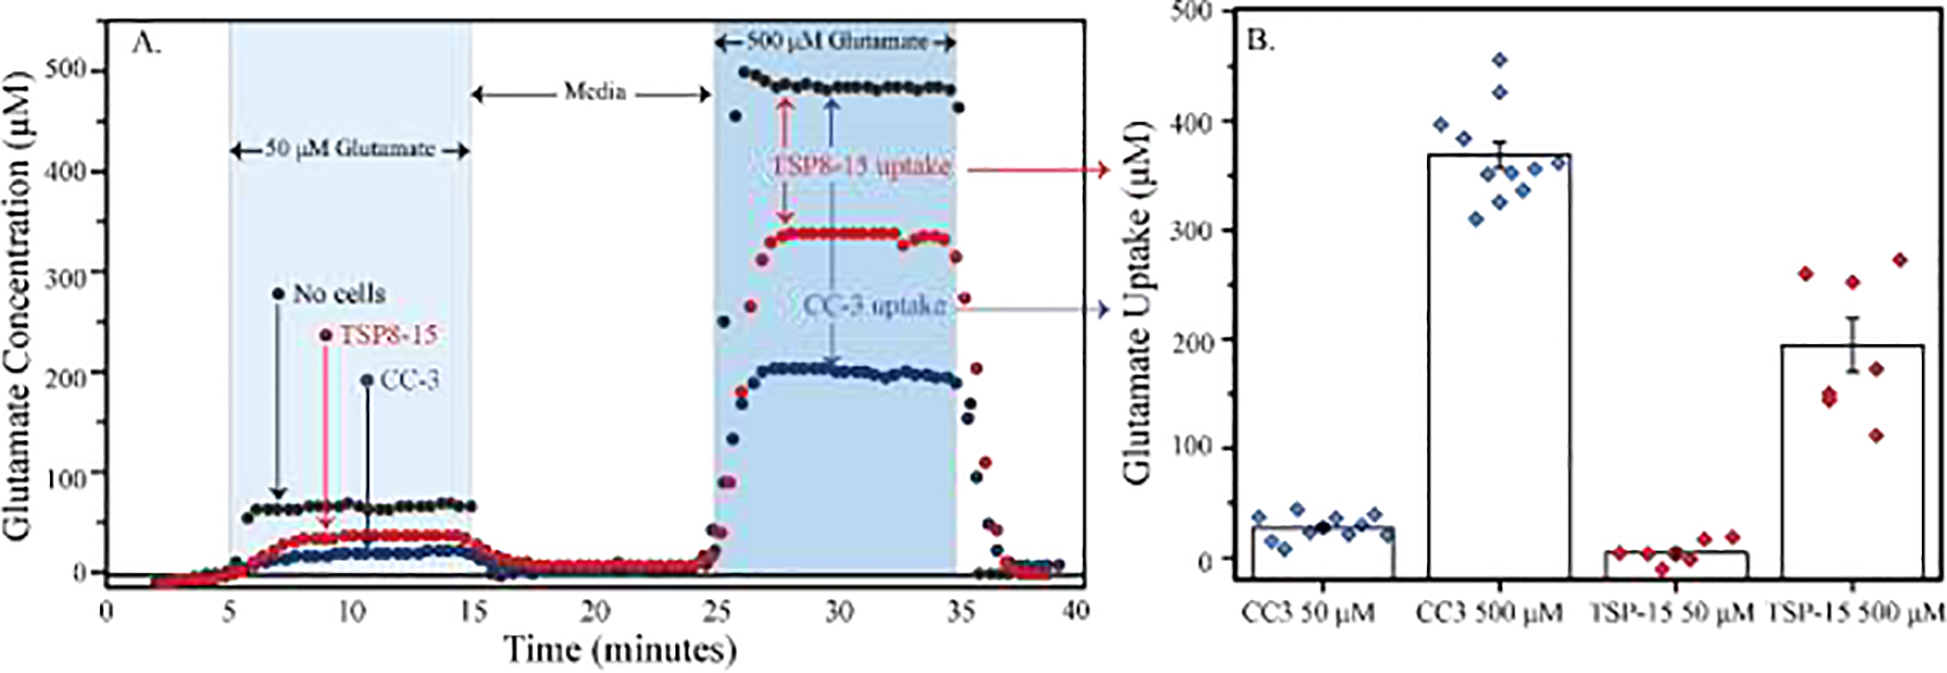
Figure 6. Representative and average glutamate microphysiometry in TSC2 mutation and control human astrocytes.

The μCA was used to monitor the response of control (CC-3) and TSC-disease (TSP8–15) astrocytes to glutamate stimulation in real time. A representative trace (A) and the average glutamate uptake (B) are plotted. A) Control (CC-3) and diseased astrocytes (TSP8–15) were grown on 12 well Transwell membranes for 8–12 days before they were loaded into the μCA bioreactor and treated with both 50 and 500 μM glutamate in BrainPhys media (represented with light and dark blue columns, respectively) and their response was measured in real time. B) Average glutamate uptake was calculated by subtracting the glutamate concentration measured from either TSP8–15 cells (red circles) or CC-3 cells (blue circles) from that with no cells (black circles). All experiments were performed at 20 μL/min, 37°C, and 5% CO2. Data are presented as mean and standard error for all measurements in (B), n= 7–11, P<0.001 resulting from a T-test with unequal variance.
