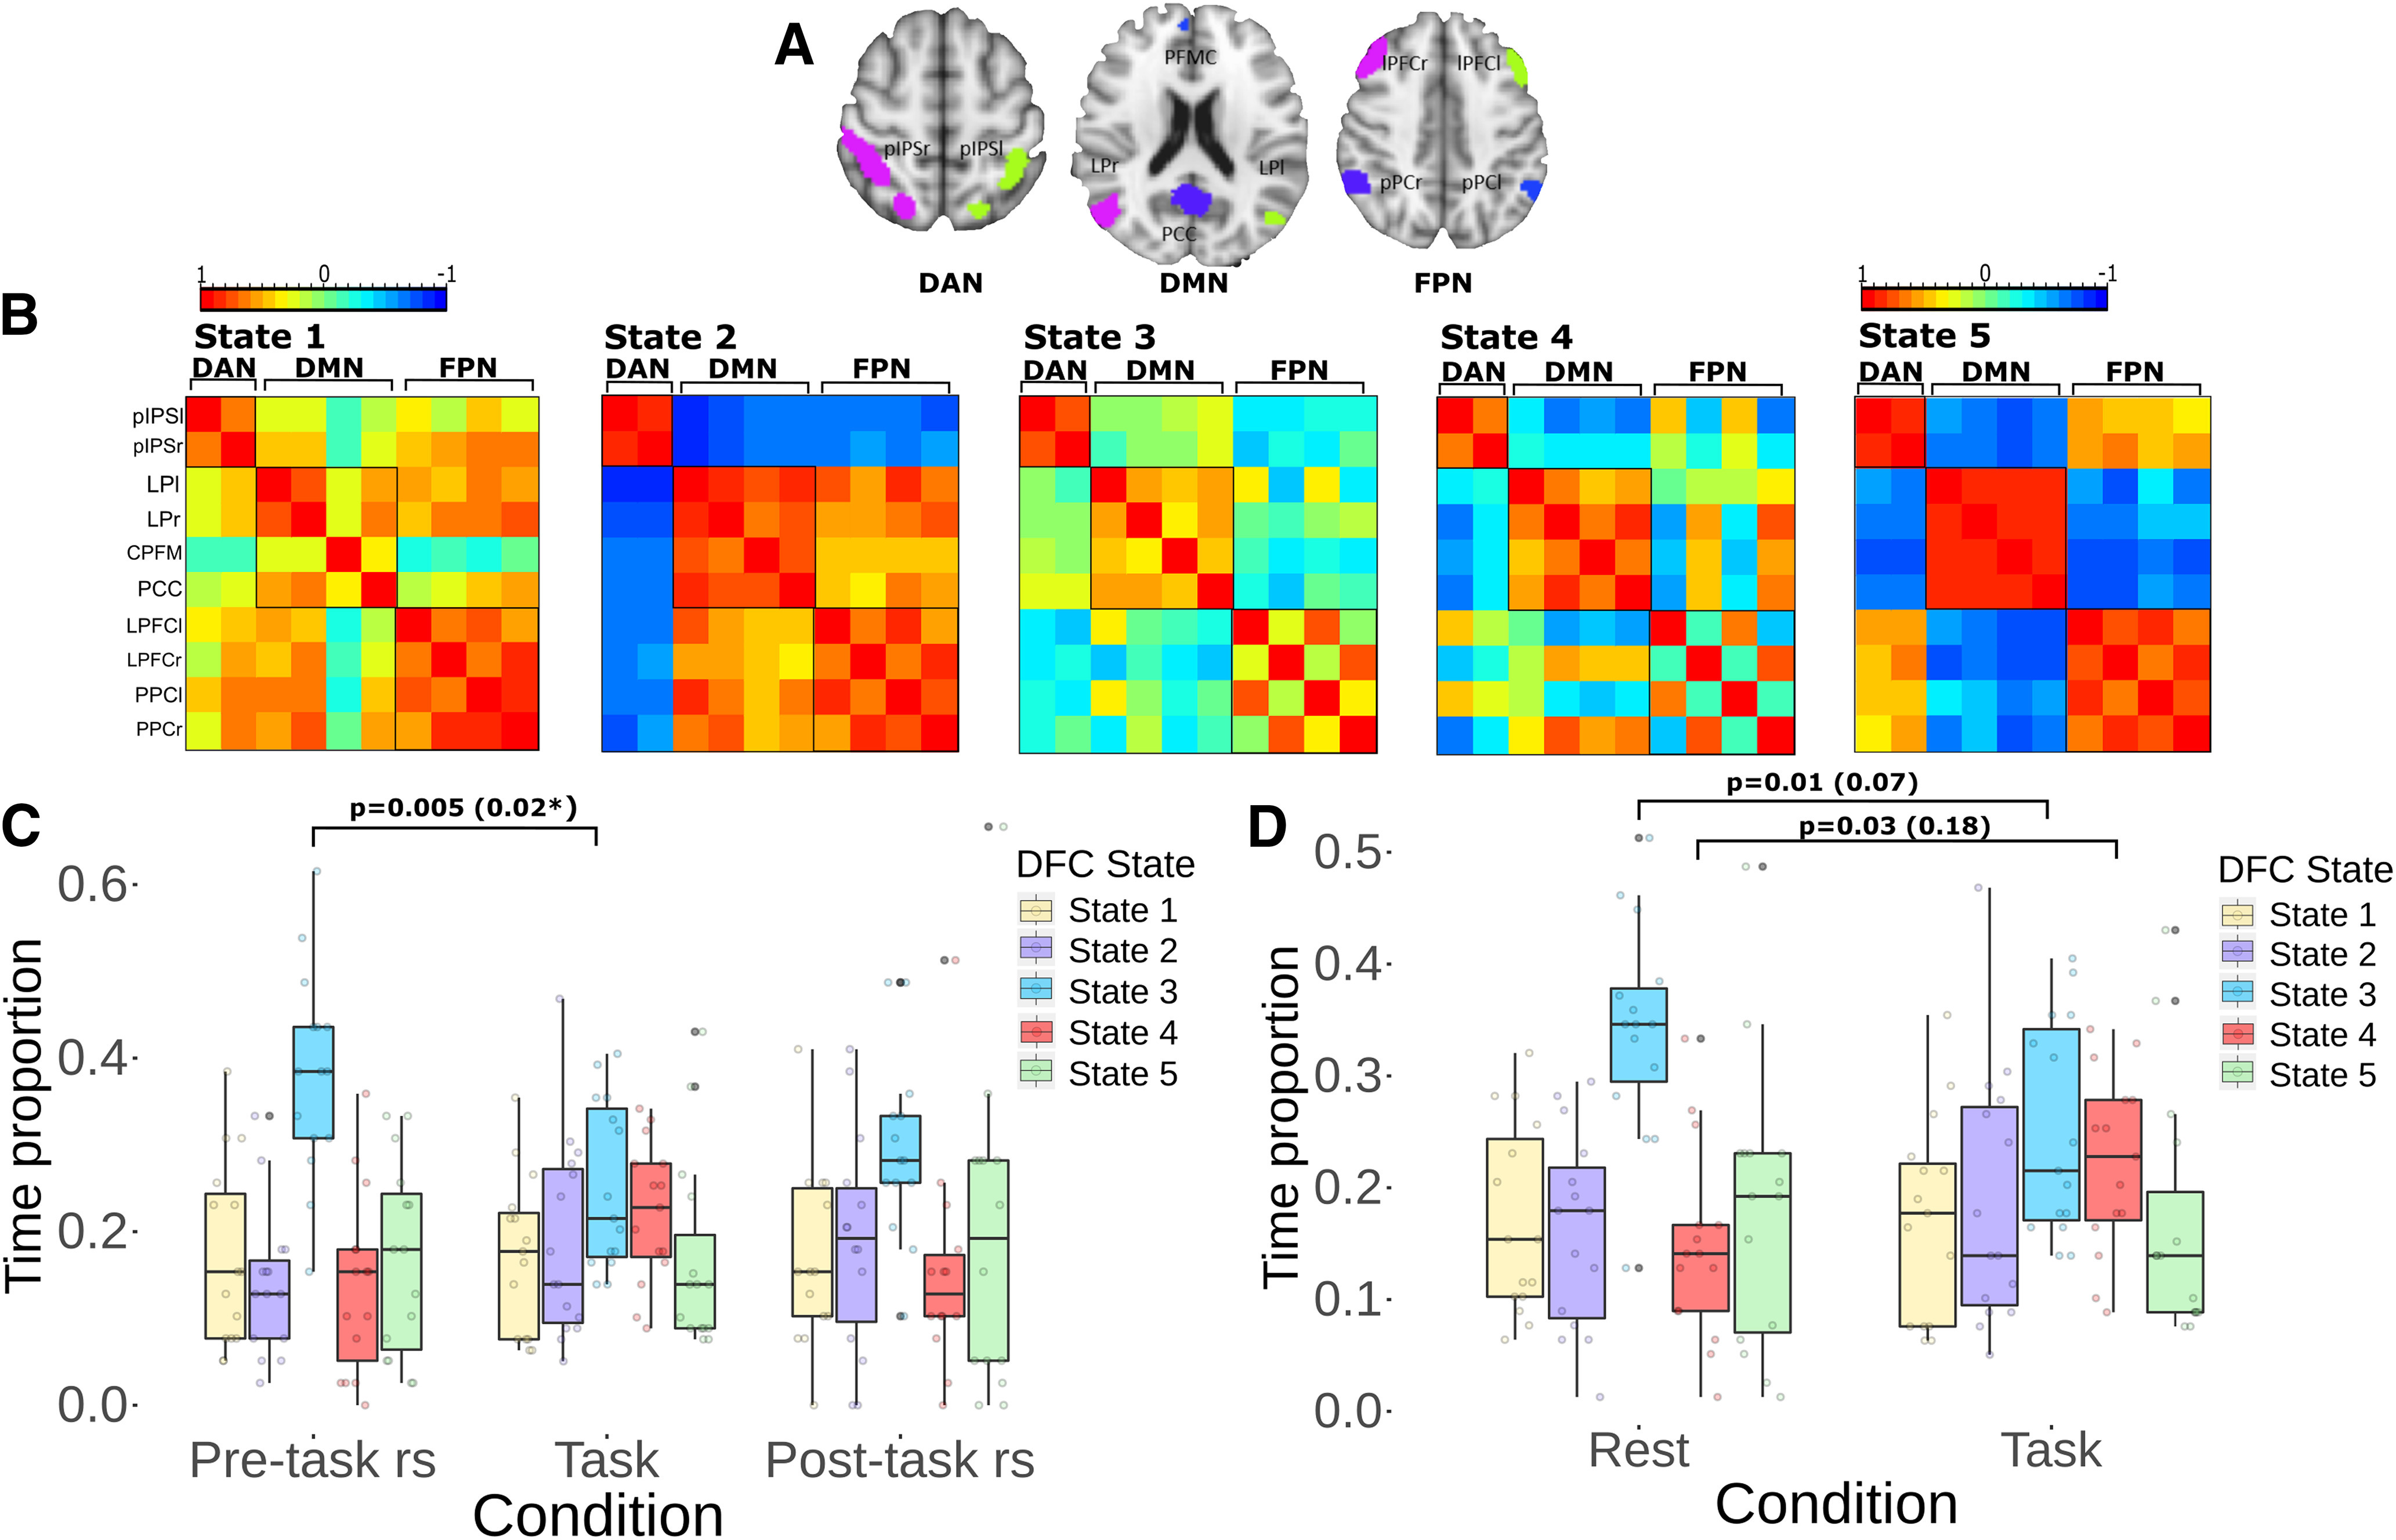
Figure 4.

DFCSs A, The individual masks where used for the analysis. B, Five DFCS were obtained each one with a characteristic FC pattern and presented across the three conditions. C, Boxplots of the proportion of time spent in each state shows differences between the three conditions. After being corrected, a significant decrease (*) in the time spent in the state 3 during the task performance in contrast with the pre-task rest was revealed. D, An analysis contrasting between both rest conditions and task showed similar results, with a decrease in the time spent in the state 3 and an increase in the time spent in the state 4 during the task, after the correction did not show significancy.
