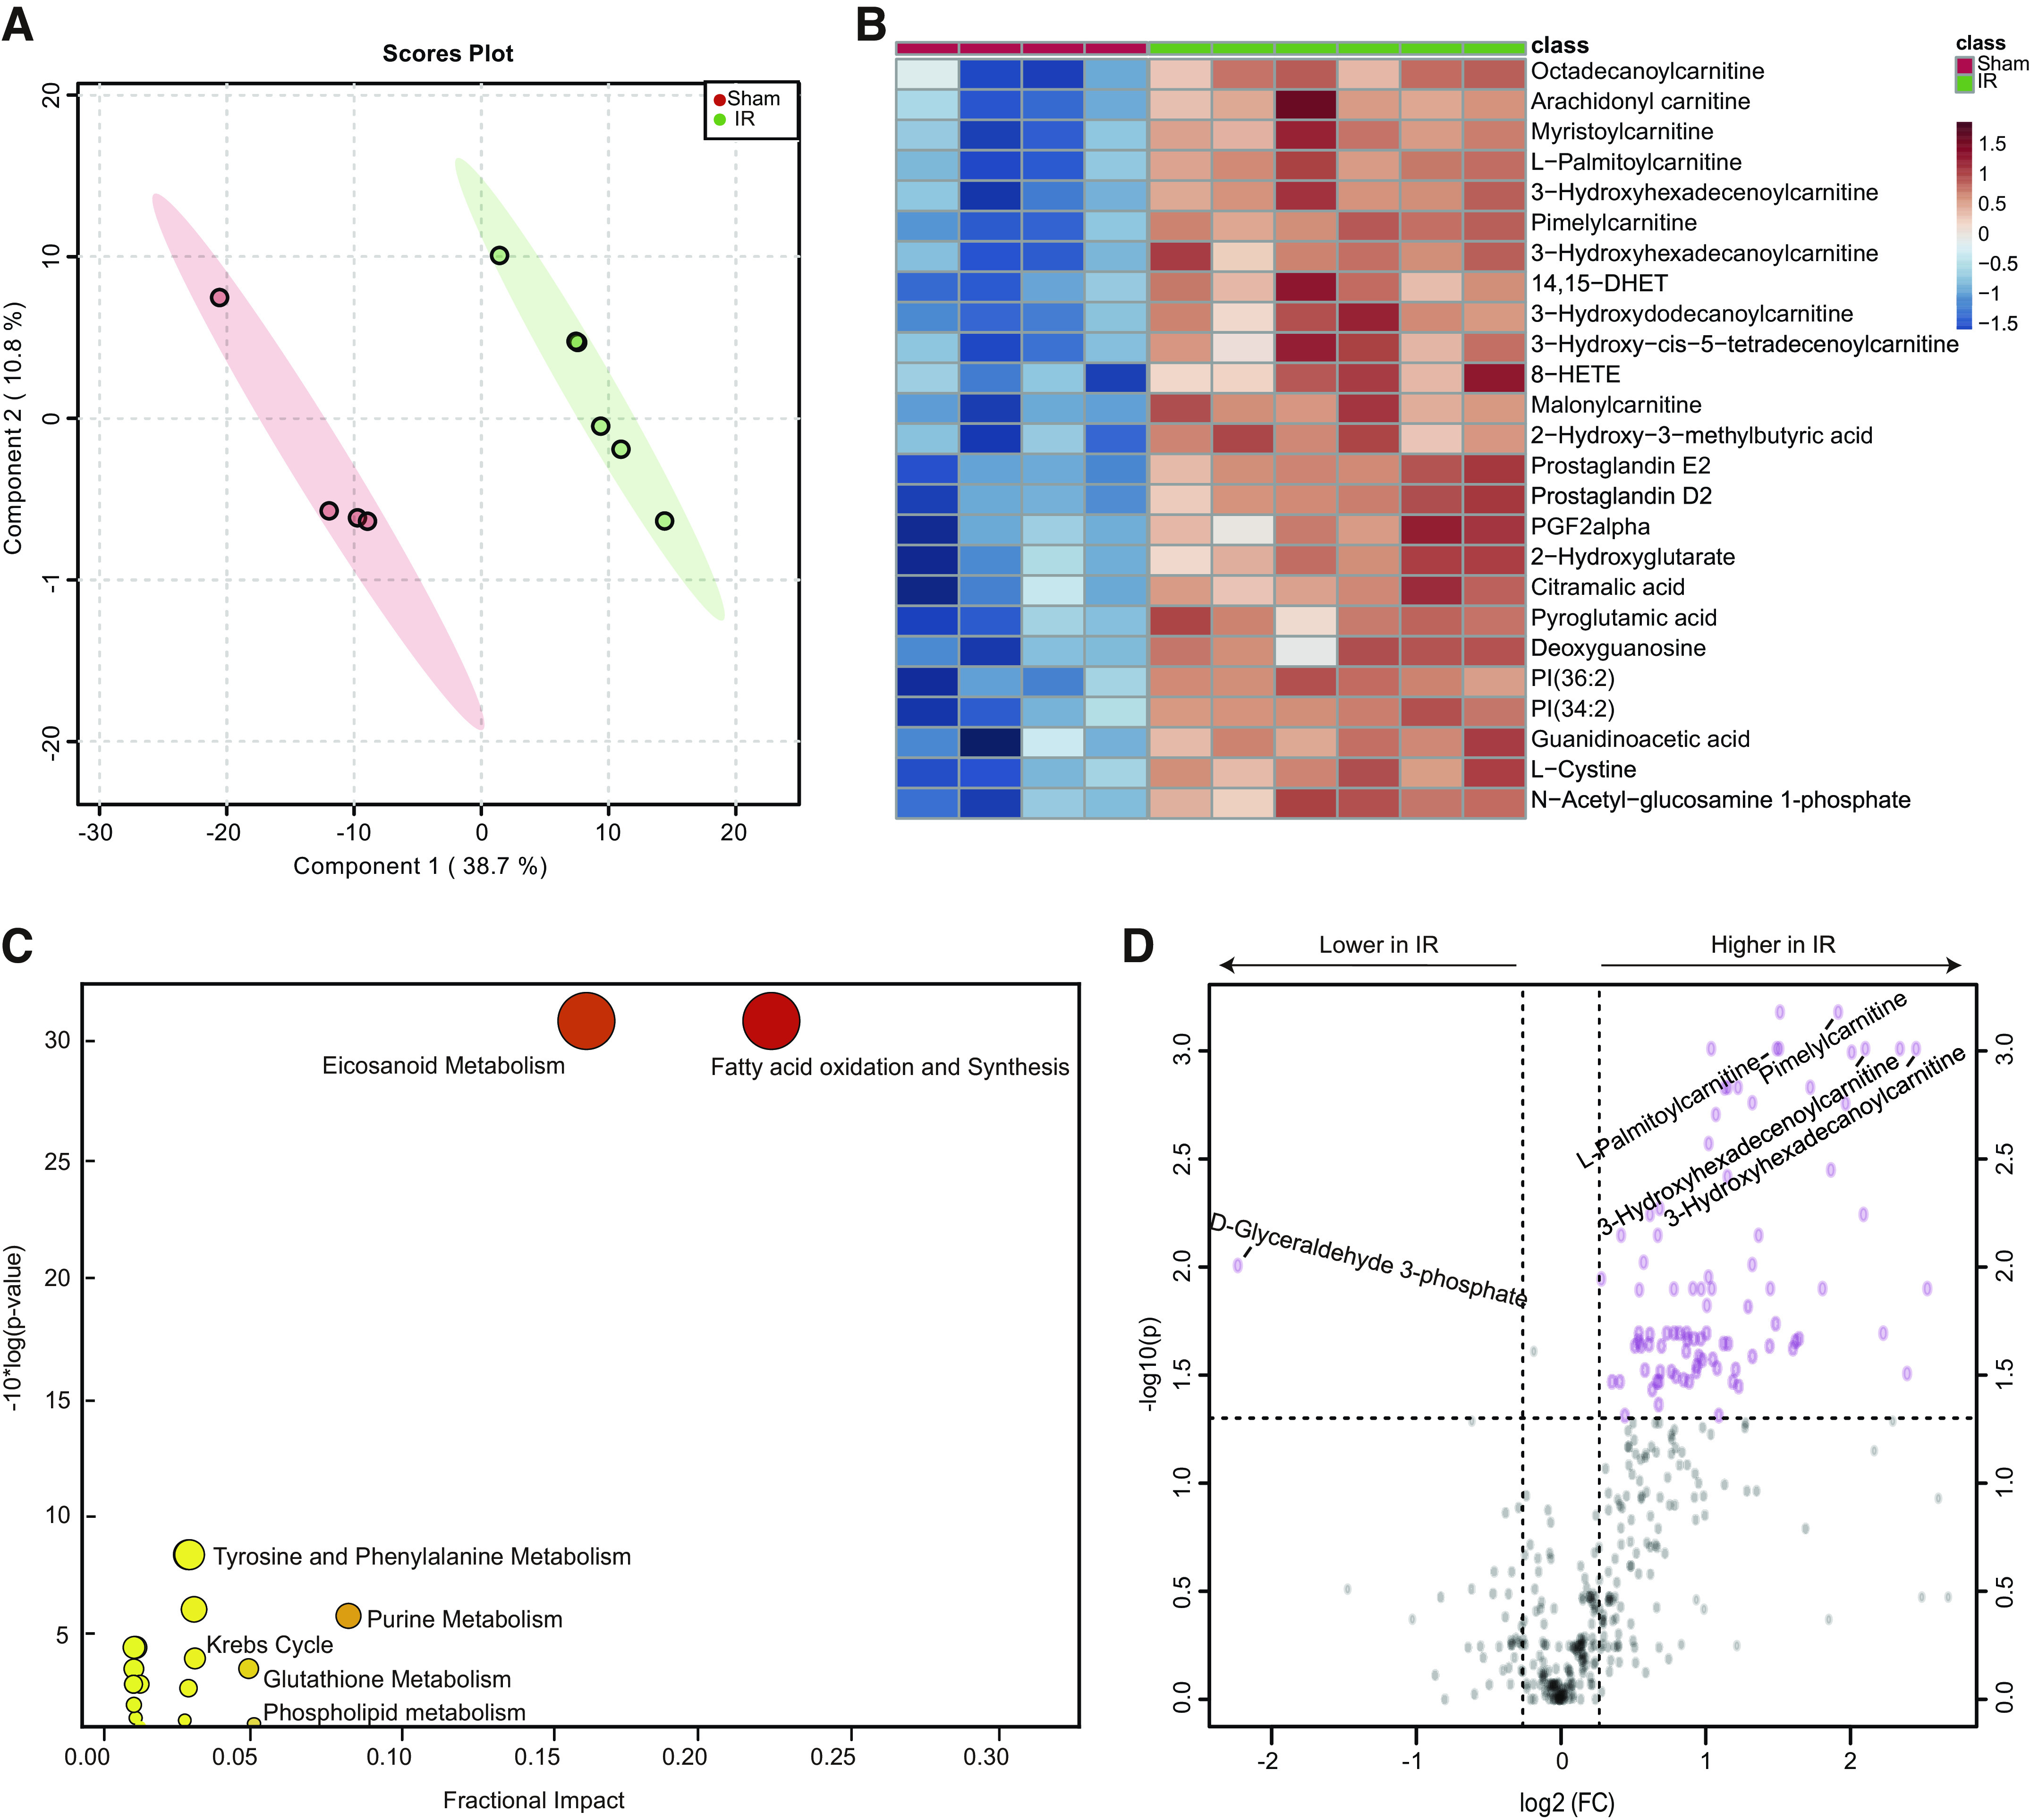
Figure 2.

Metabolomic changes in lung tissue in response to IR-AKI. A: PLS-DA showed dramatically different metabolic profiles between IR and shams. B: Top 25 metabolites altered by univariate analysis between IR and shams. C: Pathway enrichment analysis of significantly altered metabolic pathways. D: Volcano plot analysis of the significantly increased or decreased metabolites. n = 4–6/group. Fold change > 1.2 and FDR-adjusted P-value < 0.05 considered significant.
