Figure 4.
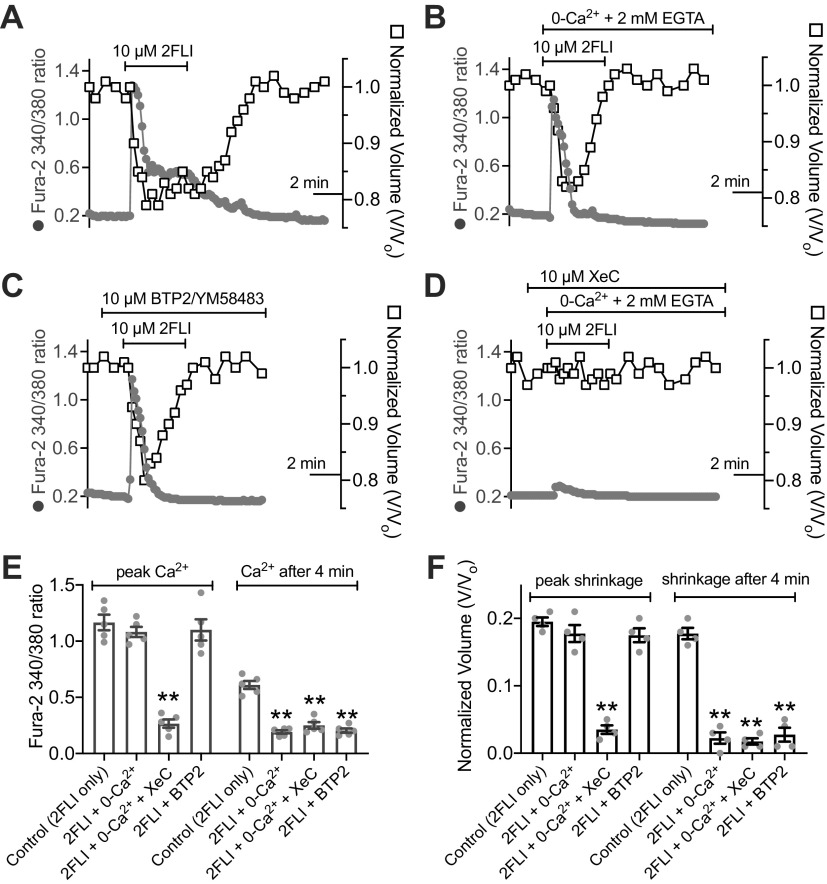
Protease-activated receptor 2 (PAR-2) activated Ca2+ signaling and shrinkage is caused by both Ca2+ release from intracellular stores as well as Ca2+ influx. A: representative graph of Ca2+ (gray circles) and volume (open squares) showing sustained shrinkage and Ca2+ elevation in response to 10 µM 2-Furoyl-LIGRLO-NH2 (2FLI). B: representative graph of transient Ca2+ and volume responses in cells stimulated with 2FLI in the absence of extracellular Ca2+ (no added Ca2+ + 2 mM EGTA). C: representative graph of transient Ca2+ and volume in response to 2FLI in the presence of BTP2 (also known as YM58483). D: representative graph of Ca2+ and volume in cells stimulated with 2FLI xestospongin C (XeC) in the absence of extracellular Ca2+. E: bar graph showing peak fura-2 340/380 ratios from independent experiments as shown in A and B. Peak ratio values were 1.17 ± 0.07 (2FLI only), 1.08 ± 0.05 (2FLI in 0-Ca2+), 0.27 ± 0.04 (2FLI in 0-Ca2+ + XeC; P < 0.01 vs. 2FLI only), 1.10 ± 0.09 (2FLI + BTP2). Fura-2 ratio after 4 min was 0.61 ± 0.04 (2FLI only), 0.19 ± 0.02 (2FLI in 0-Ca2+; **P < 0.01 vs. 2FLI only), 0.25 ± 0.03 (2FLI + 0-Ca2+ + XeC; **P < 0.01 vs. 2FLI only), 0.20 ± 0.02 (2FLI + BTP2; **P < 0.01 vs. 2FLI only); n = 4 independent experiments each using cells from two individual patients. F: bar graph showing peak shrinkage from independent experiments as show in A and B. Peak shrinkages (in %) were 20 ± 0.1 (2FLI only), 18 ± 0.01 (2FLI in 0-Ca2+), 4 ± 1 (2FLI in 0-Ca2+ + XeC), 18 ± 1 (2FLI + BTP2). Shrinkage after 4 min was 18 ± 1 (2FLI only), 2 ± 1 (2FLI in 0-Ca2+), 2 ± 0.004 (2FLI in 0-Ca2+ + XeC), 3 ± 1 (2FLI + BTP2); n = 4 independent experiments each using cells from two individual patients. Significance in E and F determined by one-way ANOVA with Bonferroni post-test comparing values to 2FLI alone (control). All bar graphs show data points from independent experiments and means ± SE.

