Figure 8.

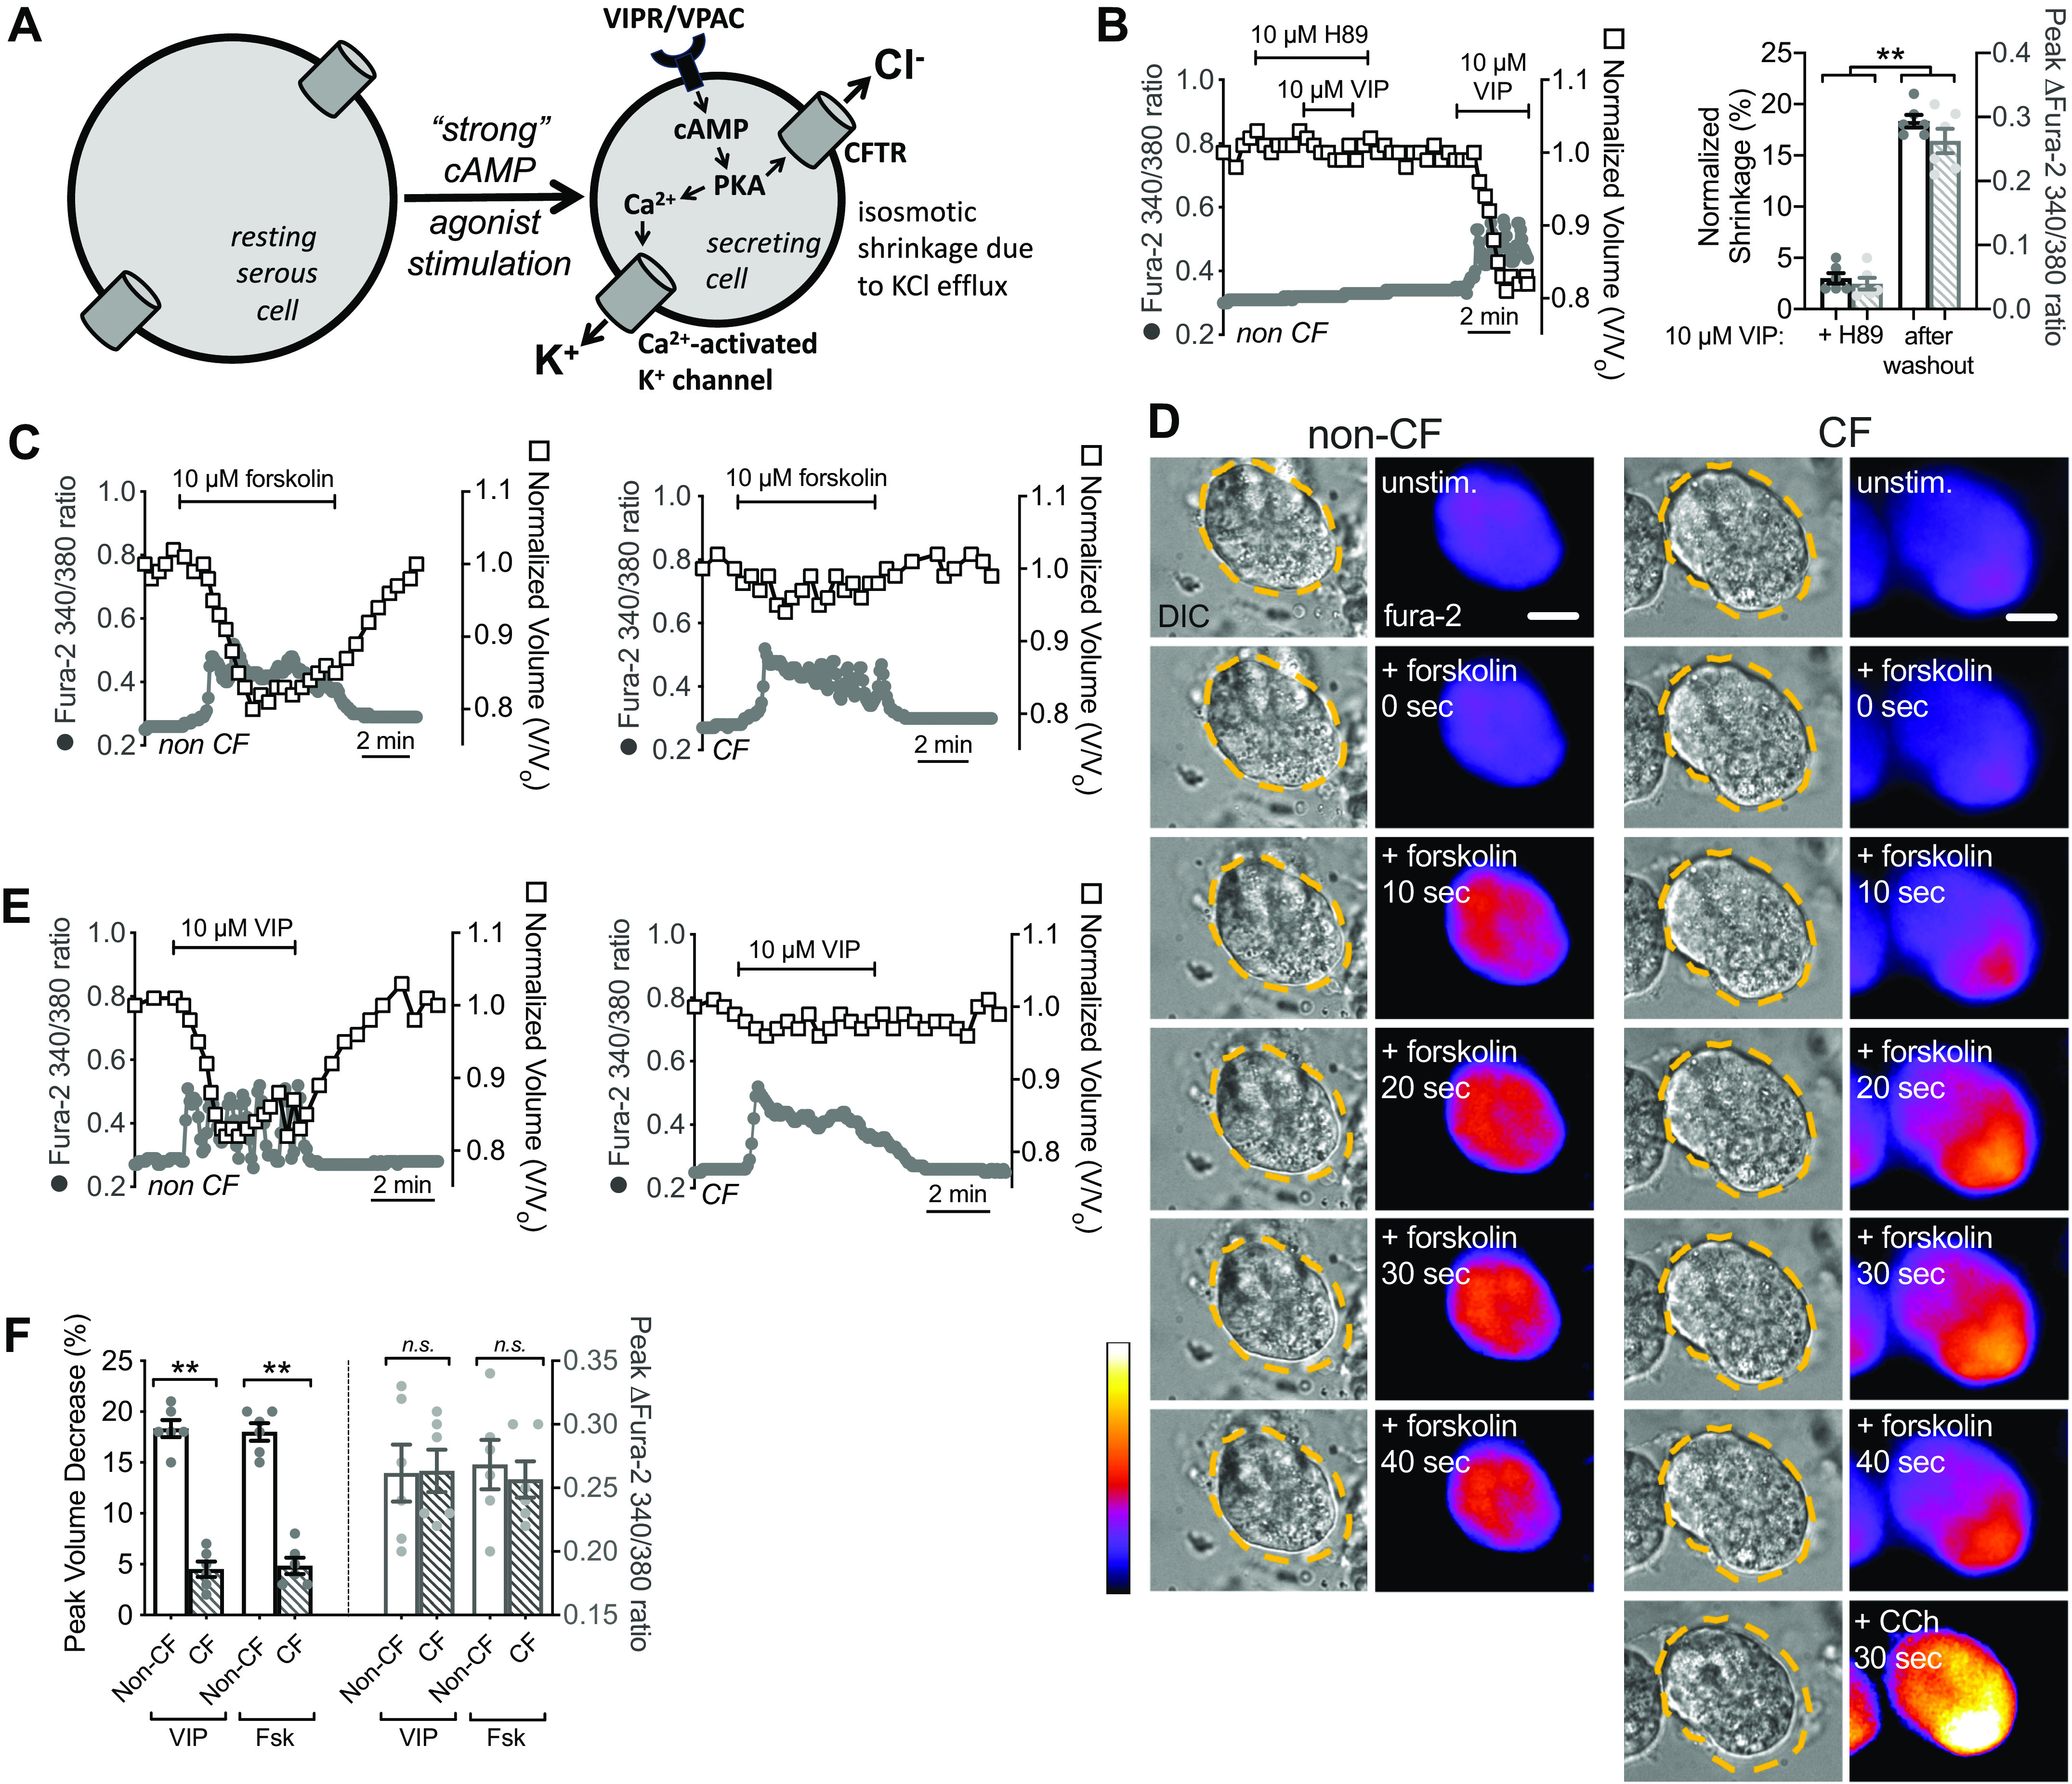
Secretion evoked by cAMP-elevating agonists is dependent on cystic fibrosis transmembrane conductance regulator (CFTR). A: diagram showing previously proposed model of cAMP-activated secretion (3, 12, 19, 35). Elevation of cAMP downstream of Gs-coupled G protein-coupled receptor (GPCRs) [vasoactive intestinal peptide receptor (VIPR) or β2Ars] causes protein kinase A (PKA)-dependent activation of CFTR as well as PKA-dependent low-level Ca2+ signaling required for K+ channel activation but insufficient to activate TMEM16A. Activation of both of these pathways results in KCl efflux and isosmotic cell shrinkage in isolated cells and acini. B: left shows representative Ca2+ (fura-2 340/380, gray circles) and volume (open squares) during vasoactive intestinal peptide (VIP) stimulation ± H89. Bar graph on right compares shrinkage and Ca2+ before and after H89. Peak shrinkages (in %) were 3 ± 1 (VIP + H89) and 18 ± 1 (VIP after H89 washout; **P <0.01). Peak fura-2 ratio changes were 0.04 ± 0.01 (VIP + H89) and 0.25 ± 0.02 (VIP after H89 washout; **P < 0.01); n = 6 independent experiments using cells from three individual patients. Significance by one-way ANOVA with Bonferroni post-test comparing each parameter between the two conditions; **P < 0.01. C: representative Ca2+ and volume traces in cells isolated from non-cystic fibrosis (CF, left) and ΔF508/ΔF508 CF cells (right) stimulated with forskolin. D: representative images showing cell volume (differential interference contrast, DIC) and low-level Ca2+ responses to 10 µM forskolin in cells from a non-CF (left) or ΔF508 CFTR homozygous CF patient (right). Note intact Ca2+ response but lack of shrinkage in CF cells. CF cells were subsequently stimulated with 10 µM carbachol (CCh) to confirm intact calcium-activated Cl− channel (CaCC)-dependent secretion. Scale bar is 10 µm. E: representative Ca2+ and volume traces in cells isolated from non-CF (left) and ΔF508/ΔF508 CF cells (right) stimulated with VIP. F: peak shrinkage (in %) was 18 ± 1 (non-CF, VIP), 5 ± 1 (CF, VIP; **P < 0.01 vs. non-CF), 18 ± 1 (non-CF, forskolin), 5 ± 1 (CF, forskolin; **P < 0.01 vs. non-CF). Peak change in fura-2 340/380 ratio was 0.26 ± 0.02 (non-CF, VIP), 0.26 ± 0.01 (CF, VIP), 0.27 ± 0.02 (non-CF, forskolin), 0.26 ± 0.01 (CF forskolin); n = 6 independent experiments using cells from three individual patients (two experiments per patient). Significance by one-way ANOVA with Bonferroni post-test with paired comparisons (non-CF vs. CF for each stimulation). Bar graphs show data points from independent experiments and means ± SE. n.s., not significant.
