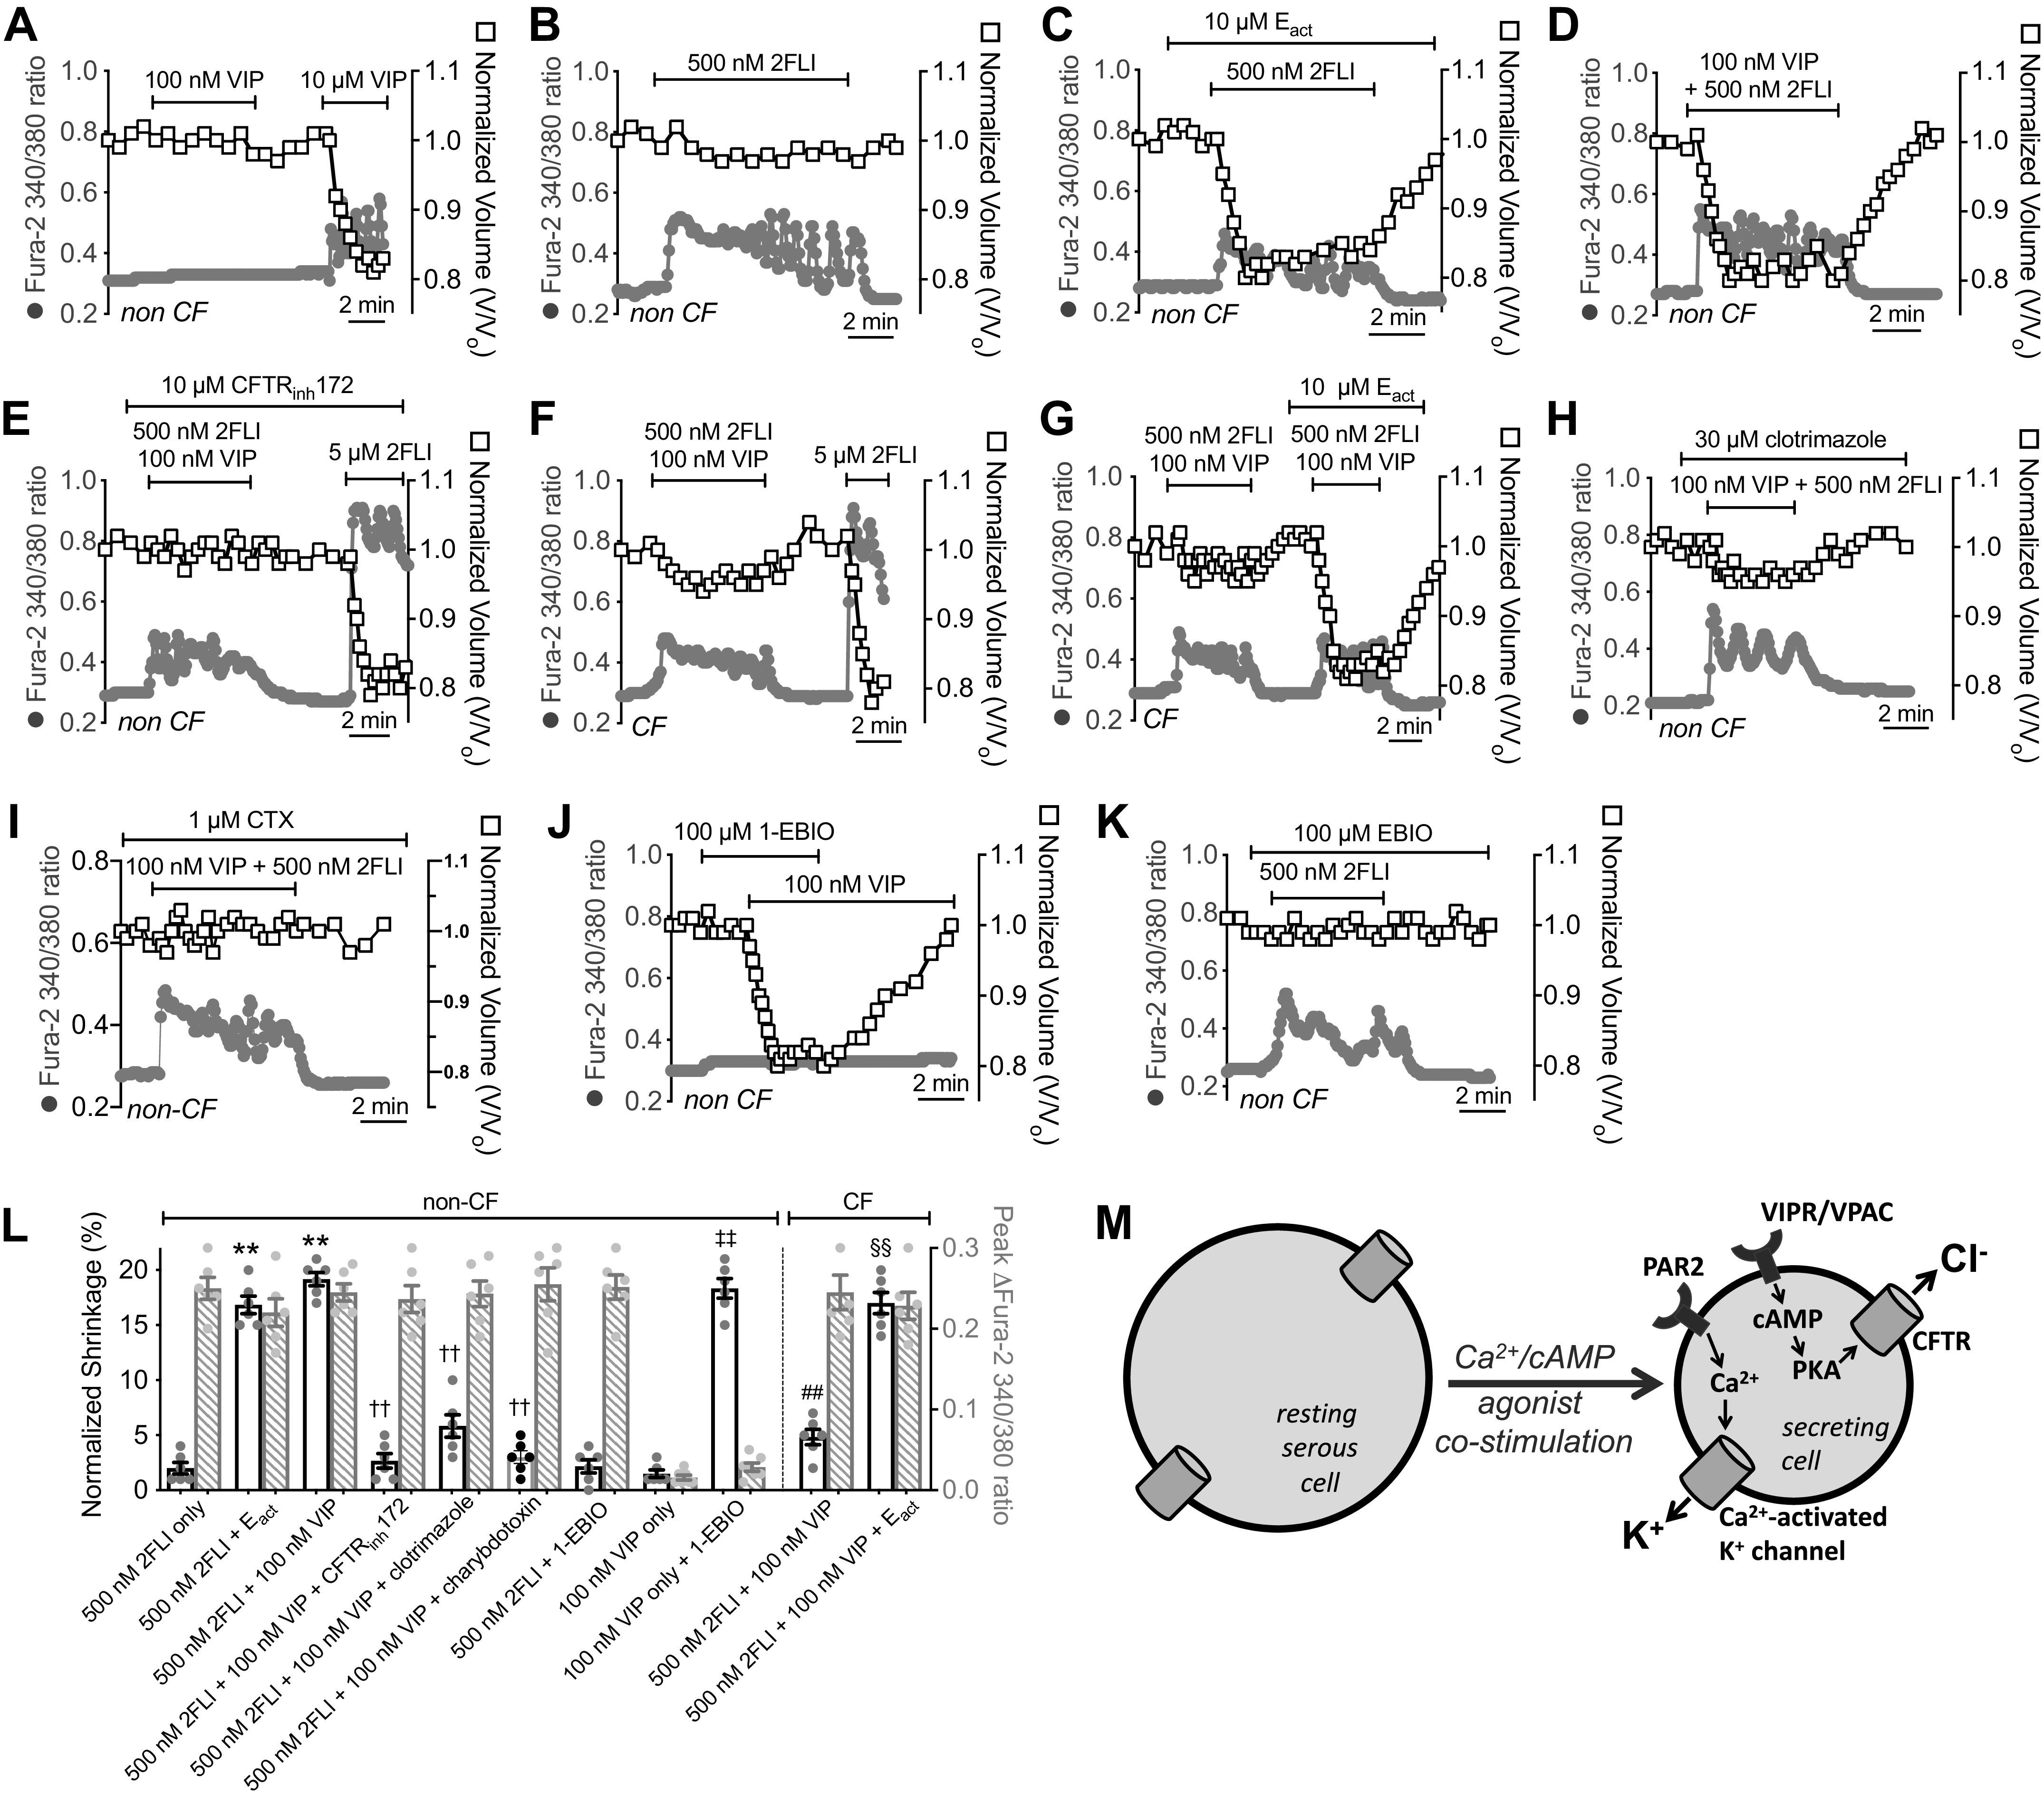
Figure 9.

Synergistic cystic fibrosis transmembrane conductance regulator (CFTR)-dependent fluid secretion is observed with low-level protease-activated receptor 2 (PAR-2) and vasoactive intestinal peptide receptor (VIPR) activation. Representative traces of Ca2+ (gray circles) and volume (open squares) during stimulation with 100 nM or 10 µM vasoactive intestinal peptide (VIP) (A) or 500 nM 2-Furoyl-LIGRLO-NH2 (2FLI) (B). C: representative traces of Ca2+ and volume during stimulation with 500 nM 2FLI + Eact. Representative traces of Ca2+ and volume during stimulation with 500 nM 2FLI + 100 nM VIP in non-cystic fibrosis (CF) cells (D), Wt cells + CFTRinh172 (E), ΔF508/ΔF508 CF cells (F), or CF cells + Eact (G). Representative traces of Ca2+ and volume during stimulation 500 nM 2FLI + 100 nM VIP in non-CF cells + clotrimazole (H) or charybdotoxin (CTX; I). Representative traces of Ca2+ and volume during stimulation with 100 nM VIP + 1-EBIO (J) or 500 nM 2FLI + 1-EBIO (K). L: bar graph showing peak shrinkage (black open bars) in non-CF cells, which was (in %) 2 ± 0.5 (500 nM 2FLI only), 17 ± 0.8 (500 nM 2FLI + Eact; **P < 0.01 vs. 500 nM 2FLI only), 2 ± 0.6 (500 nM 2FLI + 1-EBIO), 19 ± 0.6 (500 nM 2FLI + 100 nM VIP; **P < 0.01 vs. 500 nM 2FLI only), 3 ± 0.7 (500 nM 2FLI + 100 nM VIP + CFTRinh172; ††P < 0.01 vs. 500 nM 2FLI + 100 nM VIP only), 6 ± 1 (500 nM 2FLI + 100 nM VIP + clotrimazole; ††P < 0.01 vs. 500 nM 2FLI + 100 nM VIP only), 3 ± 1; 500 nM 2FLI + 100 nM VIP + charybdotoxin; ††P < 0.01 vs. 500 nM 2FLI + 100 nM VIP only), 1.5 ± 0.3 (100 nM VIP only), 18 ± 0.9 (100 nM VIP + 1-EBIO; ‡‡P < 0.01 vs. 100 nM VIP only). Peak shrinkage in CF cells was (in %) 5 ± 0.7 (500 nM 2FLI + 100 nM VIP; ##P < 0.01 vs. 500 nM 2FLI + 100 nM VIP in non-CF cells) and 17 ± 1 (500 nM 2FLI + 100 nM VIP + Eact; §§P < 0.01 vs. 500 nM 2FLI + 100 nM VIP only in CF cells). Peak change in fura-2 340/380 ratio (gray crossed bars) was 0.25 ± 0.01 (500 nM 2FLI) 0.22 ± 0.02 (500 nM 2FLI + Eact) 0.25 ± 0.02 (500 nM 2FLI + 1-EBIO), 0.25 ± 0.01 (500 nM 2FLI + 100 nM VIP), 0.24 ± 0.02 (500 nM 2FLI + 100 nM VIP + CFTRinh172), 0.24 ± 0.01 (500 nM 2FLI + 100 nM VIP + clotrimazole), 0.26 ± 0.02 (500 nM 2FLI + 100 nM VIP + charybdotoxin), 0.02 ± 0.002 (100 nM VIP only), and 0.03 ± 0.005 (100 nM VIP + 1-EBIO). Peak change in CF cells was 0.25 ± 0.02 (500 nM 2FLI + 100 nM VIP) and 0.23 ± 0.02 (500 nM 2FLI + 100 nM VIP + Eact). All bars show data points from six independent experiments using cells from three patients and means ± SE. M: diagram of proposed synergistic secretion activated by low-level PAR-2 and VIPR stimulation. Weak stimulation of PAR-2 (<EC50 for Ca2+) can elicit Ca2+ responses sufficient to activate K+ channels but not calcium-activated Cl− channel (CaCC). Weak VIPR stimulation can elicit cAMP elevations that activate CFTR but not K+ channels. Combined, this can elicit CFTR-dependent secretion.
