Figure 10.

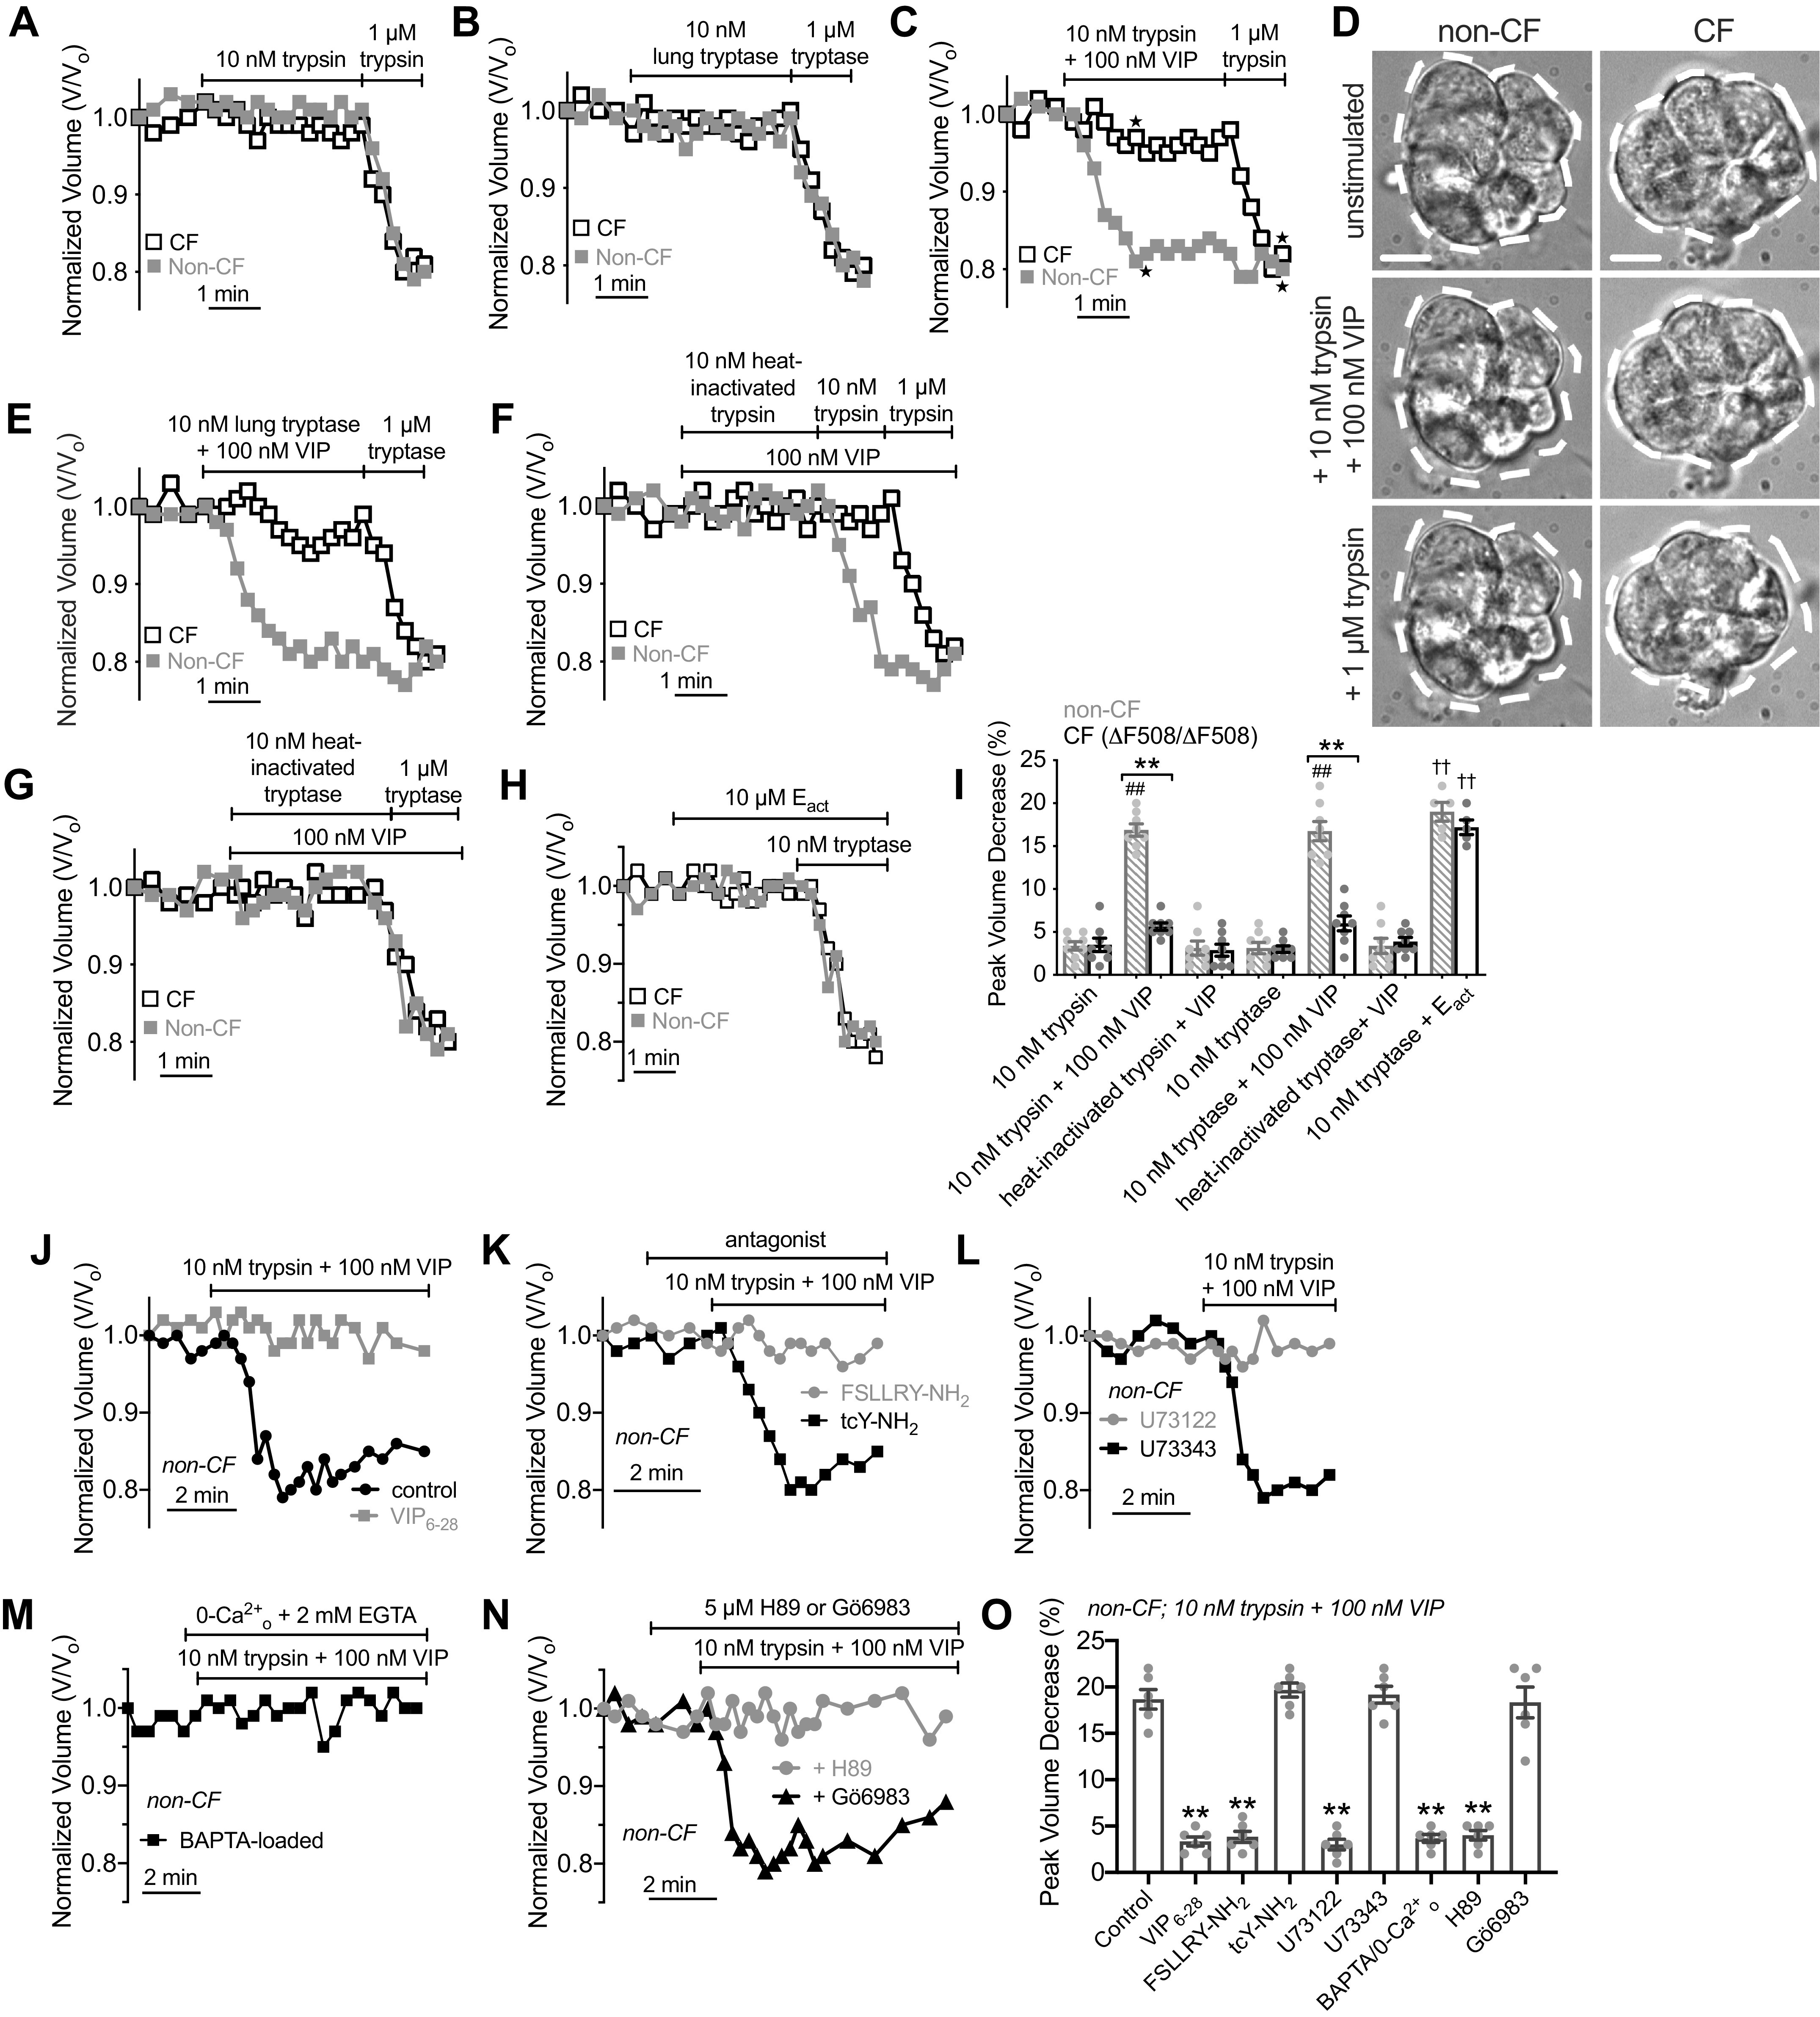
Synergistic, cystic fibrosis transmembrane conductance regulator (CFTR)-dependent fluid secretion is also observed with low-level protease and vasoactive intestinal peptide (VIP) stimulation requiring both cAMP/protein kinase A (PKA) and Ca2+. Representative cell volume traces of ΔF508/ΔF508 cystic fibrosis (CF, black open squares) and non-CF (gray solid squares) cells showing during stimulation with 10 nM or 1 µM trypsin (A) or tryptase (B). Representative cell volume traces (C) and differential interference contrast (DIC) images (D) during stimulation with 10 nM trypsin + VIP. Dotted lines represent outline of cell at time 0 (unstimulated conditions). Scale bar is 10 µm. First image in D shows time 0 on the trace; points from which subsequent images were taken are denoted with stars on graph in C. E: representative cell volume traces during stimulation with 10 nM tryptase + 100 nM VIP. To prevent degradation of VIP, trypsin and VIP were mixed from 2× solutions immediately before addition to the cells. Representative cell volume traces during stimulation with 100 nM VIP + 10 nM trypsin (E), tryptase (F), heat-inactivated trypsin (E), or heat-inactivated tryptase (F). H: representative volume traces with 10 nM trypsin + Eact. I: bar graph showing peak volume decreases (in %) in experiments as in A–G. Crossed gray bars are non-CF patients and black open bars are patients with CF. Data points are independent experiments with means ± SE, which were 3 ± 0.5 (trypsin, non-CF), 4 ± 1 (trypsin, CF), 17 ± 1 (trypsin + VIP, non-CF; ##P < 0.01 vs. trypsin alone), 4 ± 0.5 (trypsin + VIP, CF; **P < 0.01 vs. non-CF), 3.1 ± 1 (heat-inactivated trypsin + VIP, non-CF), 3 ± 1 (heat-inactivated trypsin + VIP, CF), 3 ± 1 (tryptase, non-CF), 3 ± 0.5 (tryptase, CF), 17 ± 1 (tryptase + VIP, non-CF; ##P < 0.01 vs. tryptase alone), 5 ± 1 (tryptase + VIP, CF; **P < 0.01 vs. non-CF), 3 ± 1 (heat-inactivated tryptase + VIP, non-CF), 4 ± 0.5 (heat-inactivated tryptase + VIP, CF), 19 ± 1 (tryptase + Eact, non-CF; ††P < 0.01 vs. tryptase only), 17 ± 1 (tryptase + Eact, CF; ††P < 0.01 vs. tryptase only). Significances by one-way ANOVA with Bonferroni post-test; n = 5–8 independent experiments per condition using separate samples of cells obtained from ≥2 different non-CF and ≥2 different ΔF508 CFTR homozygous CF patients. J and K: representative volume traces in non-CF cells during stimulation with 10 nM trypsin + 100 nM VIP ± VIP6–28 (10 µM), FSLLRY-NH2 (50 µM), or tcY-NH2 (50 µM). L: representative volume traces in non-CF cells during stimulation with 10 nM trypsin + 100 nM VIP ± 30 min pretreatment with 10 µM U73122 or U73343. M: representative volume trace in non-CF cells during stimulation with 10 nM trypsin + 100 nM VIP in BAPTA-loaded cells stimulated in 0-Ca2+o (2 mM EGTA) extracellular solution. N: representative volume traces showing inhibition of shrinkage responses in non-CF cells during stimulation with 10 nM trypsin + 100 nM VIP ± 10 µM H89 or Gö6983. O: bar graph showing peak volume decreases (in %; means ± SE) from experiments as in I–M, which were 19 ± 1 (control), 3 ± 1 (VIP6–28), 4 ± 1 (FSLLRY-NH2), 20 ± 1 (tcY-NH2), 3 ± 1 (U73122), 19 ± 1 (U73343), 4 ± 1 (BAPTA/0-Ca2+), 4 ± 1 (H89), 18 ± 2 (Gö6983). Significance determined by one-way ANOVA with Dunnett’s post-test with **P < 0.01 vs. control. Data points shown are independent experiments (n = 6 using independent samples of cells from ≥2 different non-CF patients).
