Figure 11.
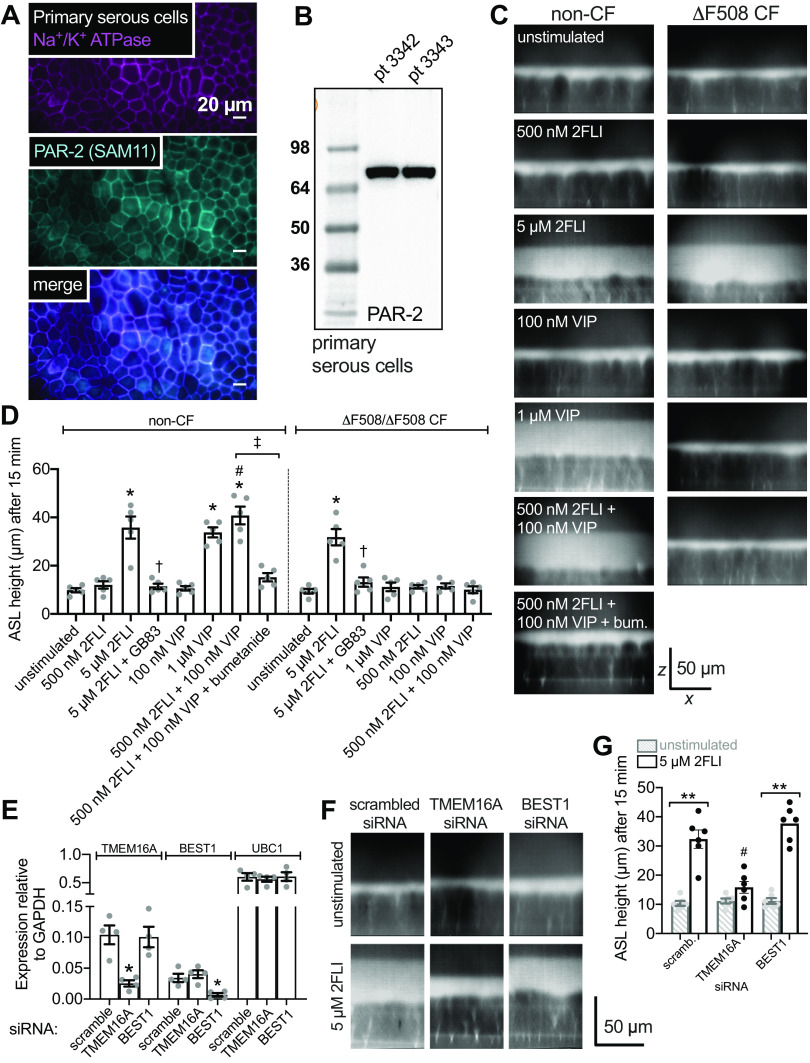
Polarized fluid secretion in air-liquid interface (ALI) cultures of primary nasal serous cells supports synergistic cystic fibrosis transmembrane conductance regulator (CFTR)-dependent secretion elicited by low-level protease-activated receptor 2 (PAR-2) and vasoactive intestinal peptide (VIP)ergic stimulation. A: confocal micrograph of methanol-fixed primary serous ALI showing immunofluorescence of Na+/K+ ATPase (magenta; Abcam ab76020 rabbit monoclonal antibody) and PAR-2 (cyan; SAM11 mouse monoclonal antibody). Both antibodies exhibited lateral membrane staining. Results representative of independent cultures from three patients. B: Western blot for PAR-2 (Abcam ab180953 rabbit monoclonal antibody) from ALIs from two separate patients. Results representative of four ALIs from four patients. C: representative orthogonal sections from confocal stacks [×60 1.4 numerical aperture (NA) oil objective, 0.3 µm step size] showing Texas red dextran-labeled airway surface liquid (ASL) in individual cultures from non-cystic fibrosis (CF, left) and ΔF508/ΔF508 CF cultures (right) after stimulation as indicated. Note z-axis scale bar is not calibrated for refractive index mismatch, as discussed in methods. D: bar graph of ASL heights from independent experiments as in C (n = 5 per condition using ALIs from five patients). ASL heights in non-CF cultures were (in µm) 10 ± 1 (unstimulated), 12 ± 2 [500 nM 2-Furoyl-LIGRLO-NH2 (2FLI)], 36 ± 5 (5 µM 2FLI; *P < 0.05 vs. unstimulated), 11 ± 1 (5 µM 2FLI + 50 µM GB83; †P < 0.05 vs. 5 µM 2FLI alone), 11 ± 1 (100 nM VIP), 34 ± 2 (1 µM VIP; *P < 0.05 vs. unstimulated), 41 ± 4 (500 nM 2FLI + 100 nM VIP; *P < 0.05 vs unstimulated; #P < 0.05 vs. either 500 nM 2FLI or 100 nM VIP alone), 15 ± 2 (500 nM 2FLI + 100 nM VIP + 100 µM bumetanide; ‡P < 0.05 vs. 500 nM 2FLI + 100 nM VIP without bumetanide). ASL heights in CF cultures were 9 ± 1 (unstimulated), 11 ± 1 (500 nM 2FLI), 31 ± 3 (5 µM 2FLI; *P < 0.05 vs. unstimulated), 13 ± 2 (5 µM 2FLI + 50 µM GB83; †P < 0.05 vs. 5 µM 2FLI alone), 12 ± 1 (100 nM VIP), 11 ± 2 (1 µM VIP), 10 ± 1 (500 nM 2FLI + 100 nM VIP). Significance by one-way ANOVA with Bonferroni post-test with paired comparisons. E: expression of TMEM16A (Ca2+-activated Cl− channel), BEST1 (Ca2+-activated Cl− channel), and UBC1 (housekeeping control) relative to GAPDH ± scrambled, TMEM16A, or BEST1 siRNAs (n = 4 ALIs, two each from two individual patients). Expression of TMEM16A was 0.10 ± 0.02 (scrambled siRNA), 0.025 ± 0.01 (TMEM16A siRNA; *P < 0.05 vs. scrambled), and 0.10 ± 0.02 (BEST1 siRNA). Expression of BEST1 was 0.03 ± 0.007 (scramble siRNA), 0.04 ± 0.006 (TMEM16A siRNA), 0.007 ± 0.003 (BEST1 siRNA; *P < 0.05 vs. scrambled). Expression of UBC1 was 0.60 ± 0.07 (scramble siRNA), 0.56 ± 0.05 (TMEM16A siRNA), and 0.61 ± 0.08 (BEST1 siRNA). Significance by one-way ANOVA with Bonferroni post-test. F: representative orthogonal sections of unstimulated (top) or 5 µM 2FLI stimulated ALIs treated with scrambled, TMEM16A, or BEST1 siRNAs. G: bar graph showing mean ASL heights from experiments as in F (n = 6 ALIs, three each from two individual patients). Mean ASL height was 10 ± 1 (unstimulated + scrambled siRNA), 32 ± 2 (5 µM 2FLI + scrambled siRNA; **P < 0.01 vs. unstimulated + scrambled siRNA), 11 ± 1 (unstimulated + TMEM16A siRNA), 16 ± 5 (5 µM 2FLI + TMEM16A siRNA; n.s. vs. unstimulated + TMEM16A siRNA; #P < 0.05 vs. 5 µM 2FLI + either scrambled or BEST1siRNA), 11 ± 1 (unstimulated + BEST1 siRNA), and 38 ± 2 (5 µM 2FLI + BEST1 siRNA; **P < 0.01 vs. unstimulated + BEST1 siRNA). Significance by one-way ANOVA with Bonferroni posttest. Data points in all bar graphs are independent experiments and error bars are SE.

