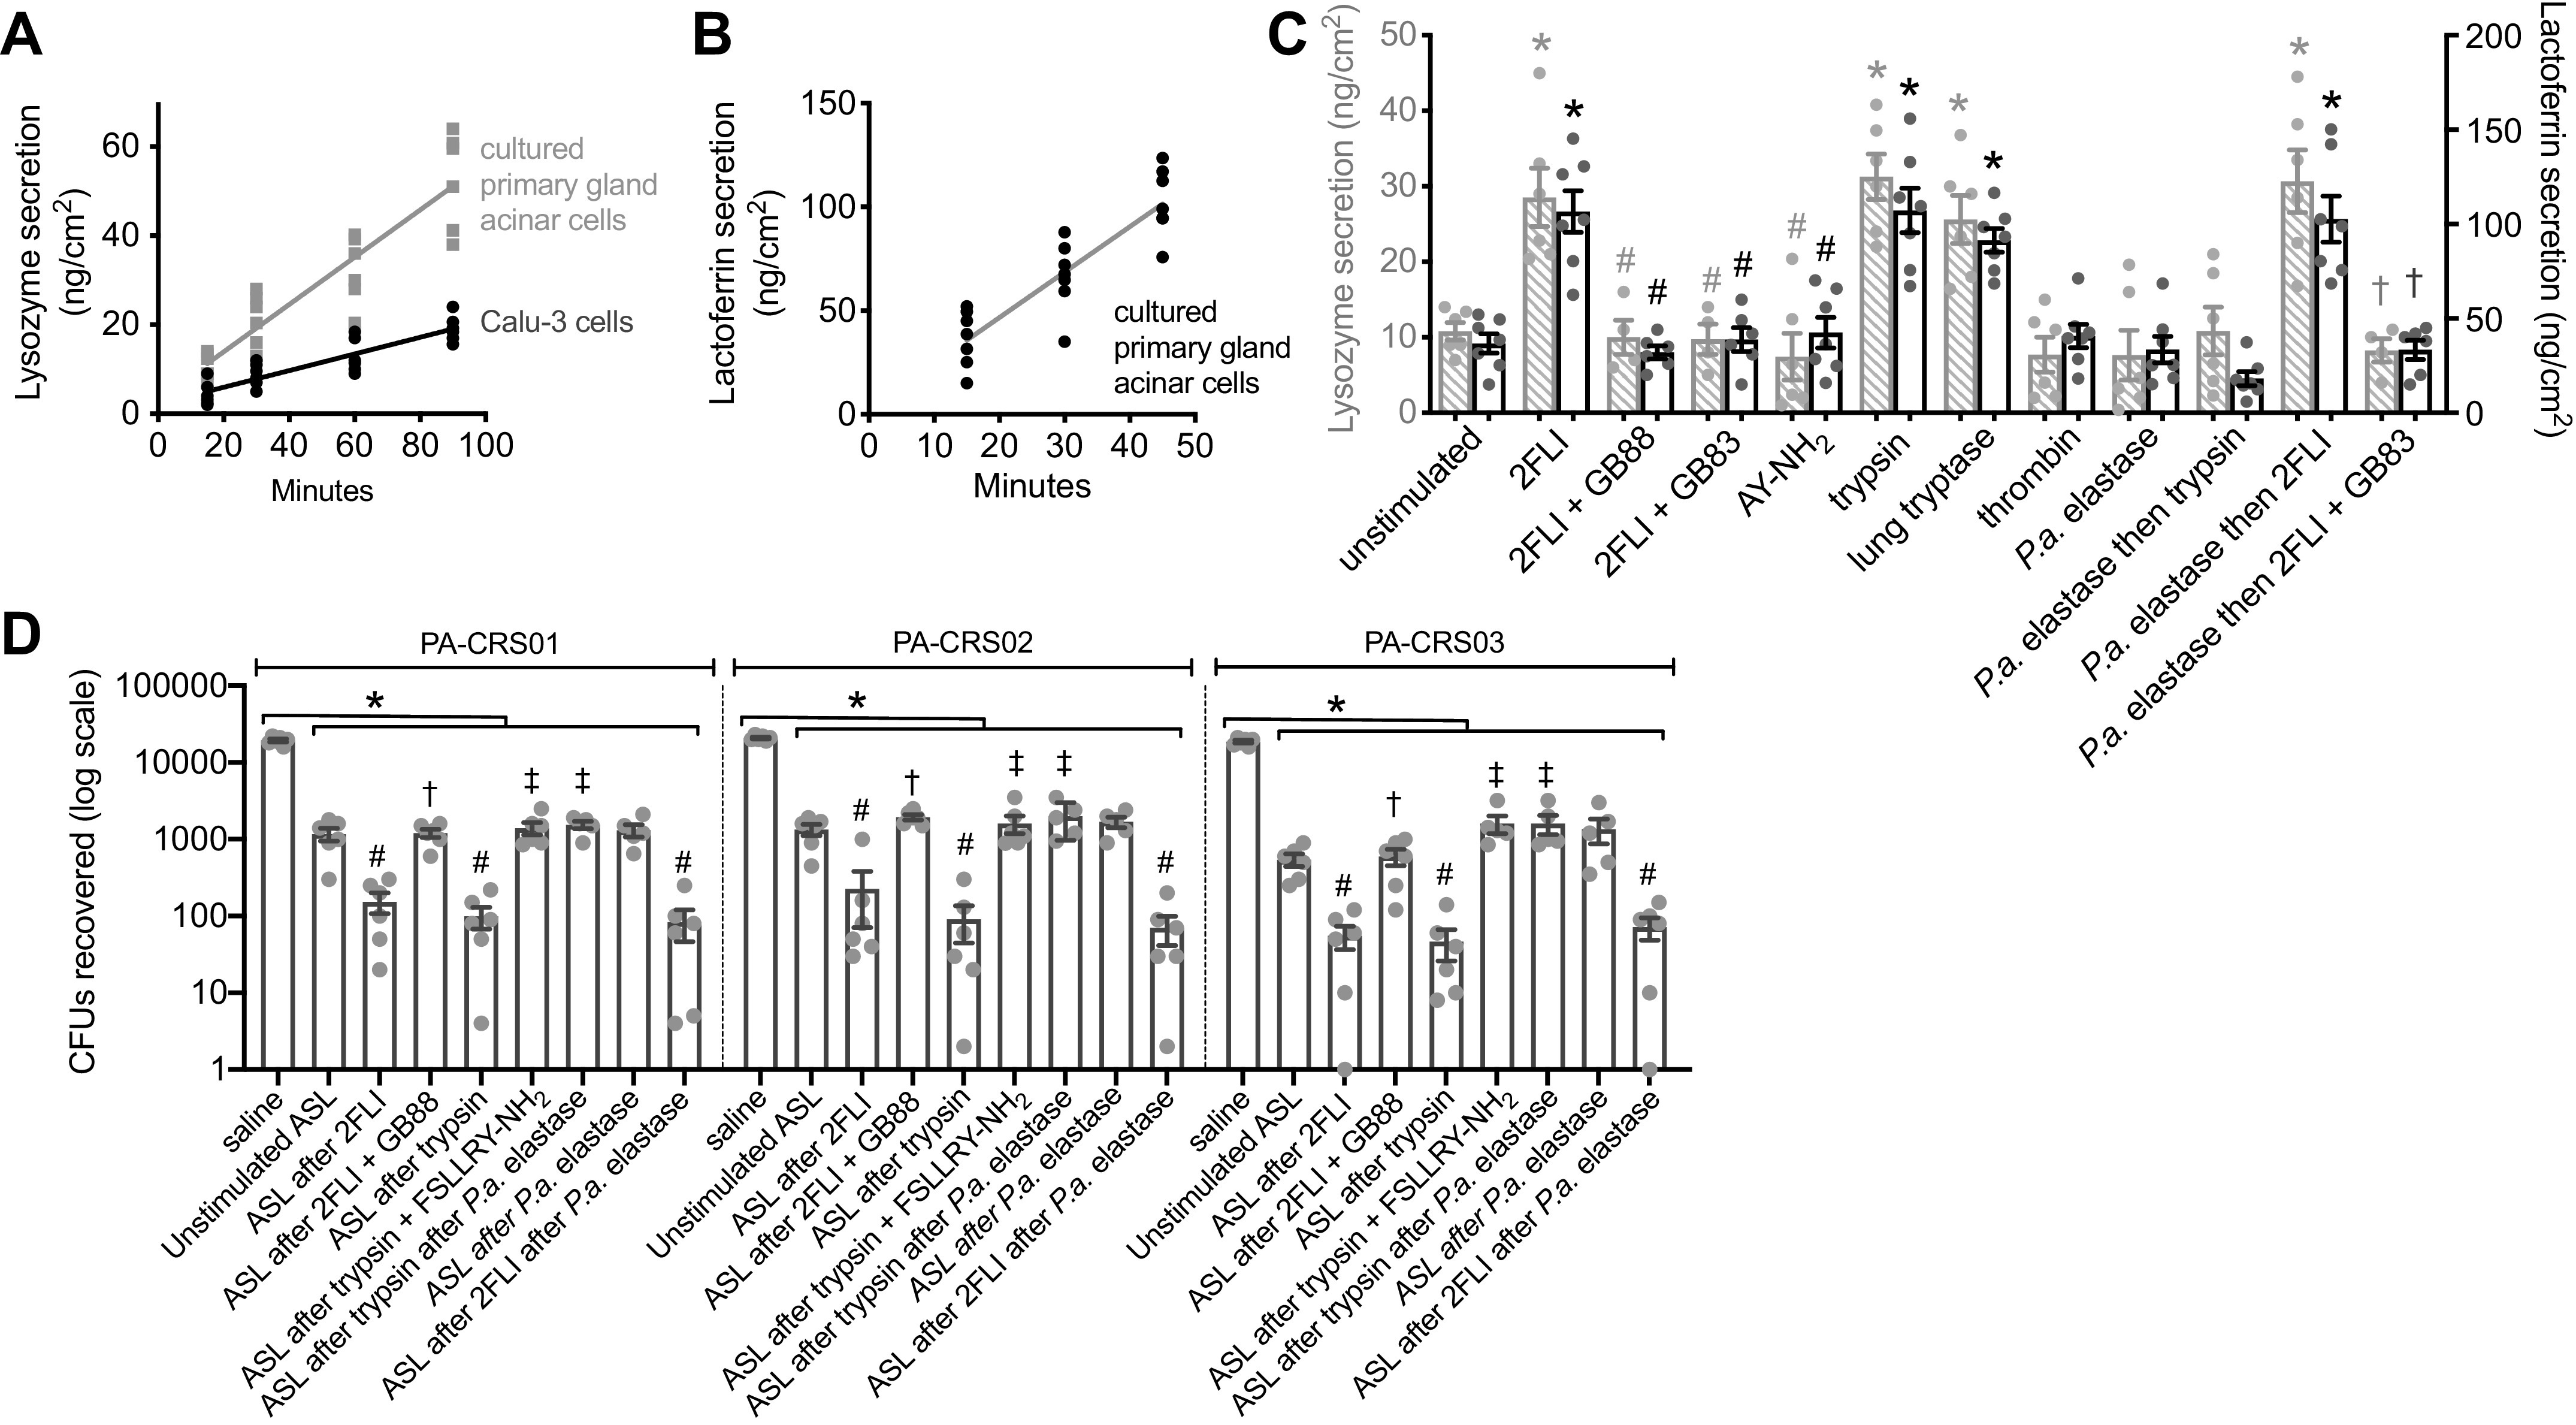
Figure 15.

Inhibition of protease protease-activated receptor 2 (PAR-2)-activated antimicrobial peptide secretion by Pseudomonas aeruginosa (P.a.) secreted products. A: graph showing secretion of lysozyme [measured by ELISA as in Ref. (12)] in primary serous cell air-liquid interfaces (ALIs, gray squares) and Calu-3 ALIs (black circles); n = 3–5 independent experiments per time point per cell type. B: graph showing secretion of lactoferrin (measured by ELISA) in primary serous ALIs. C: bar graph from independent experiments showing apical lysozyme (gray crossed bars) and lactoferrin (black open bars) secretion after basolateral stimulation as indicated. Lysozyme secretion was 11 ± 1 (unstimulated), 29 ± 4 (10 µM 2-Furoyl-LIGRLO-NH2, 2FLI), 10 ± 2 (2FLI + 25 µM GB88), 9 ± 2 (2FLI + 25 µM GB83), 7 ± 3 (20 µM AY-NH2), 31 ± 3 (100 nM trypsin), 26 ± 3 (100 nM tryptase), 8 ± 2 (100 nM thrombin), 8 ± 3 (100 nM P.a. elastase), 11 ± 3 (P.a. elastase then trypsin), 31 ± 4 (P.a. elastase then 2FLI), 8 ± 2 (P.a. elastase then 2FLI + GB83). Lactoferrin secretion was 37 ± 5 (unstimulated), 107 ± 11 (2FLI), 32 ± 3 (2FLI + GB88), 39 ± 6 (2FLI + GB83), 43 ± 8 (AY-NH2), 107 ± 12 (trypsin), 91 ± 6 (tryptase), 41 ± 6 (thrombin), 34 ± 7 (P.a. elastase), 18 ± 4 (P.a. elastase then trypsin), 103 ± 12 (P.a. elastase then 2FLI), 33 ± 5 (P.a. elastase then 2FLI + GB83). Significances determined by one-way ANOVA with Bonferroni post-test with *P < 0.05 vs. unstimulated ASL, #P < 0.05 vs. 2FLI-stimluted ASL, †P < 0.05 vs. P.a. elastase then 2FLI; n = 6–7 independent experiments using cultures from ≥2 different patients. D: secretions from stimulated primary serous cell ALIs were collected and mixed with clinical P. aeruginosa as described in the text. Bar graph (note log scale) shows colony forming units (CFUs) remaining from independent experiments. PAO-CRS01 CFUs remaining were 19,333 ± 881 (saline only), 1,167 ± 223 (unstimulated ASL), 153 ± 46 [10 µM 2FLI-stimulated airway surface liquid (ASL)], 1,200 ± 148 (2FLI + 30 µM GB88), 99 ± 31 (100 nM trypsin), 1,392 ± 256 (trypsin + 100 µM FSLLRY-NH2), 1,680 ± 263 (100 nM P.a. elastase), 1,540 ± 175 (P.a. elastase then trypsin), 83 ± 37 (P.a. elastase then 2FLI). PAO-CRS02 CFUs remaining were 20,833 ± 601 (saline only), 1,325 ± 239 (unstimulated ASL), 227 ± 156 (2FLI-stimluated ASL), 1,933 ± 152 (2FLI + GB88), 90 ± 46 (trypsin), 1,598 ± 415 (trypsin + FSLLRY-NH2), 1,310 ± 240 (P.a. elastase), 1,990 ± 456 (P.a. elastase then trypsin), 70 ± 29 (P.a. elastase then 2FLI). PAO-CRS03 CFUs remaining were 18,667 ± 803 (saline only), 542 ± 100 (unstimulated ASL), 55 ± 19 (2FLI-stimluated ASL), 595 ± 142 (2FLI + GB88), 46 ± 20 (trypsin), 1,594 ± 412 (trypsin + FSLLRY-NH2), 1,350 ± 479 (P.a. elastase), 1,600 ± 451 (P.a. elastase then trypsin), 72 ± 23 (P.a. elastase then 2FLI). Significances determined by one-way ANOVA with Bonferroni post-test with *P < 0.05 vs. saline, #P < 0.05 vs. unstimulated ASL, †P < 0.05 vs. 2FLI stimulated ASL, and ‡P < 0.05 vs. trypsin-stimulated ASL; n = 5–6 independent experiments using cultures from ≥2 different patients. For all bar graphs, data points are independent experiments and error bars are SE.
