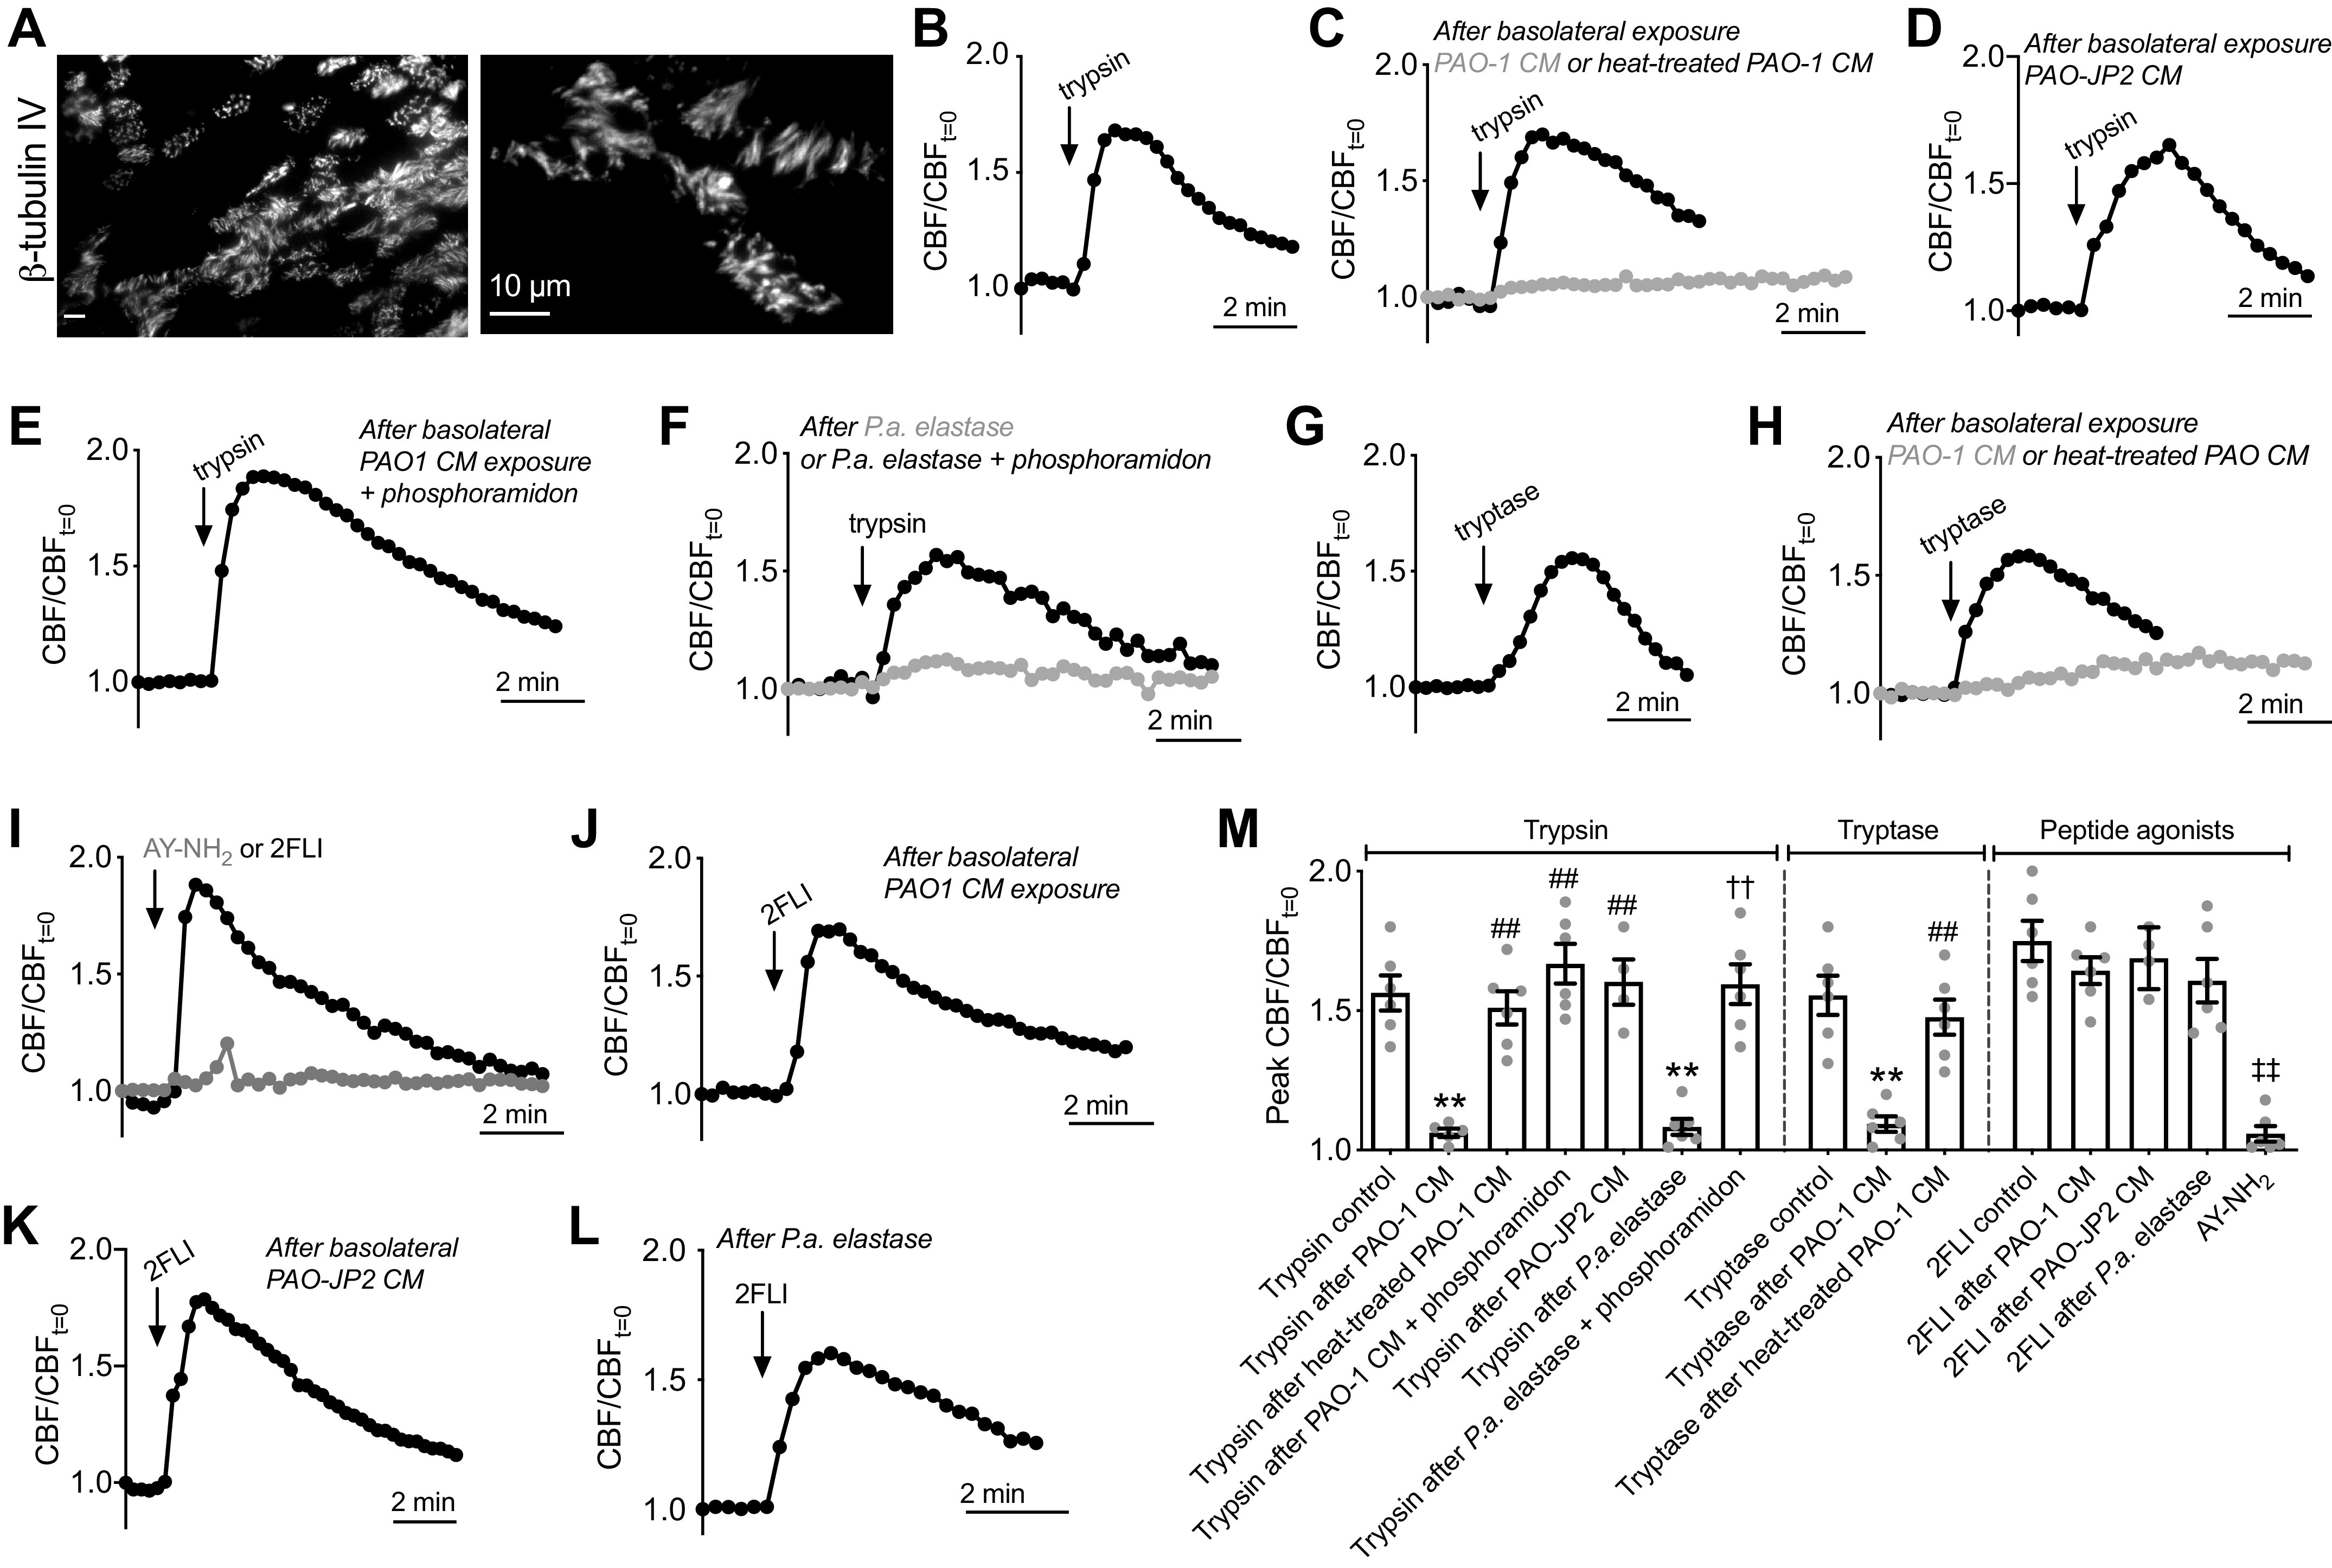
Figure 16.

Exposure to Pseudomonas aeruginosa conditioned media (CM) also inhibits protease activation of protease-activated receptor 2 (PAR-2)-stimulated ciliary beat frequency (CBF) increase. A: immunofluorescence image of β-tubulin IV showing motile cilia on a surface epithelial air-liquid interface (ALI) culture [×60, 1.4 numerical aperture (NA) wide-field image; Abcam ab11315 mouse monoclonal antibody]. B: representative trace of CBF during stimulation with basolateral trypsin (5 µM) previously shown to be dependent on PAR-2 (57, 58). Representative CBF traces in response to basolateral trypsin after basolateral pre-exposure to PAO-1 CM (C; gray trace), heat-inactivated PAO-1 CM (C; black trace), PAO-JP2 CM (D), or PAO-1 CM treated with phosphoramidon (E). Mean raw starting CBF was not different after exposure to LB only (7.3 ± 0.2 Hz), PAO-1 CM (7.1 ± 0.3 Hz), or PAO-JP2 CM (7.5 ± 0.4 Hz), or PAO-1 CM + phosphoramidon (7.6 ± 0.2 Hz); P < 0.05 by one-way ANOVA with Bonferroni posttest. F: representative CBF traces after pre-exposure to P. aeruginosa (P.a.) elastase (500 nM; gray trace) ± phosphoramidon (black trace). G: representative CBF traces during stimulation with human lung tryptase (5 µM). H: representative tryptase responses PAO-1 CM (gray) or heat-treated PAO-1 CM (black). 2-Furoyl-LIGRLO-NH2 (2FLI) (10 µM) but not AY-NH2 (10 µM) also increased CBF (I), and 2FLI CBF increases were unaffected by PAO-1 CM (J), PAO-JP2 CM (K), or P.a. elastase (L). M: peak normalized CBF was 1.56 ± 0.06 (trypsin control), 1.06 ± 0.02 (trypsin after PAO-1 CM; **P < 0.01 vs. trypsin only control), 1.51 ± 0.06 (trypsin after heat-treated PAO-1 CM; ##P < 0.01 vs. trypsin after PAO-1 CM), 1.67 ± 0.07 (trypsin after PAO-1 CM + phosphoramidon; ##P < 0.01 vs. trypsin after PAO-1 CM), 1.60 ± 0.08 (trypsin after PAO-JP2 CM; ##P < 0.01 vs. trypsin after PAO-1 CM), 1.08 ± 0.03 (trypsin after P.a. elastase; **P < 0.01 vs. trypsin only control), 1.59 ± 0.07 (trypsin after P.a. elastase + phosphoramidon; ††P < 0.01 vs. trypsin after P.a. elastase), 1.56 (tryptase control), 1.09 ± 0.03 (tryptase after PAO-1 CM), 1.48 ± 0.06 (tryptase after heat-treated PAO-1 CM), 1.75 ± 0.07 (2FLI control), 1.64 ± 0.05 (2FLI after PAO-1 CM), 1.69 ± 0.06 (2FLI after PAO-JP2 CM), 1.61 ± 0.08 (2FLI after P.a. elastase), 1.06 (AY-NH2; ‡‡P < 0.01 vs. 2FLI only). Significance by one-way ANOVA with Bonferroni posttest; n = 5–6 independent experiments with cultures from ≥2 patients. Data points are independent experiments and error bars are SE.
