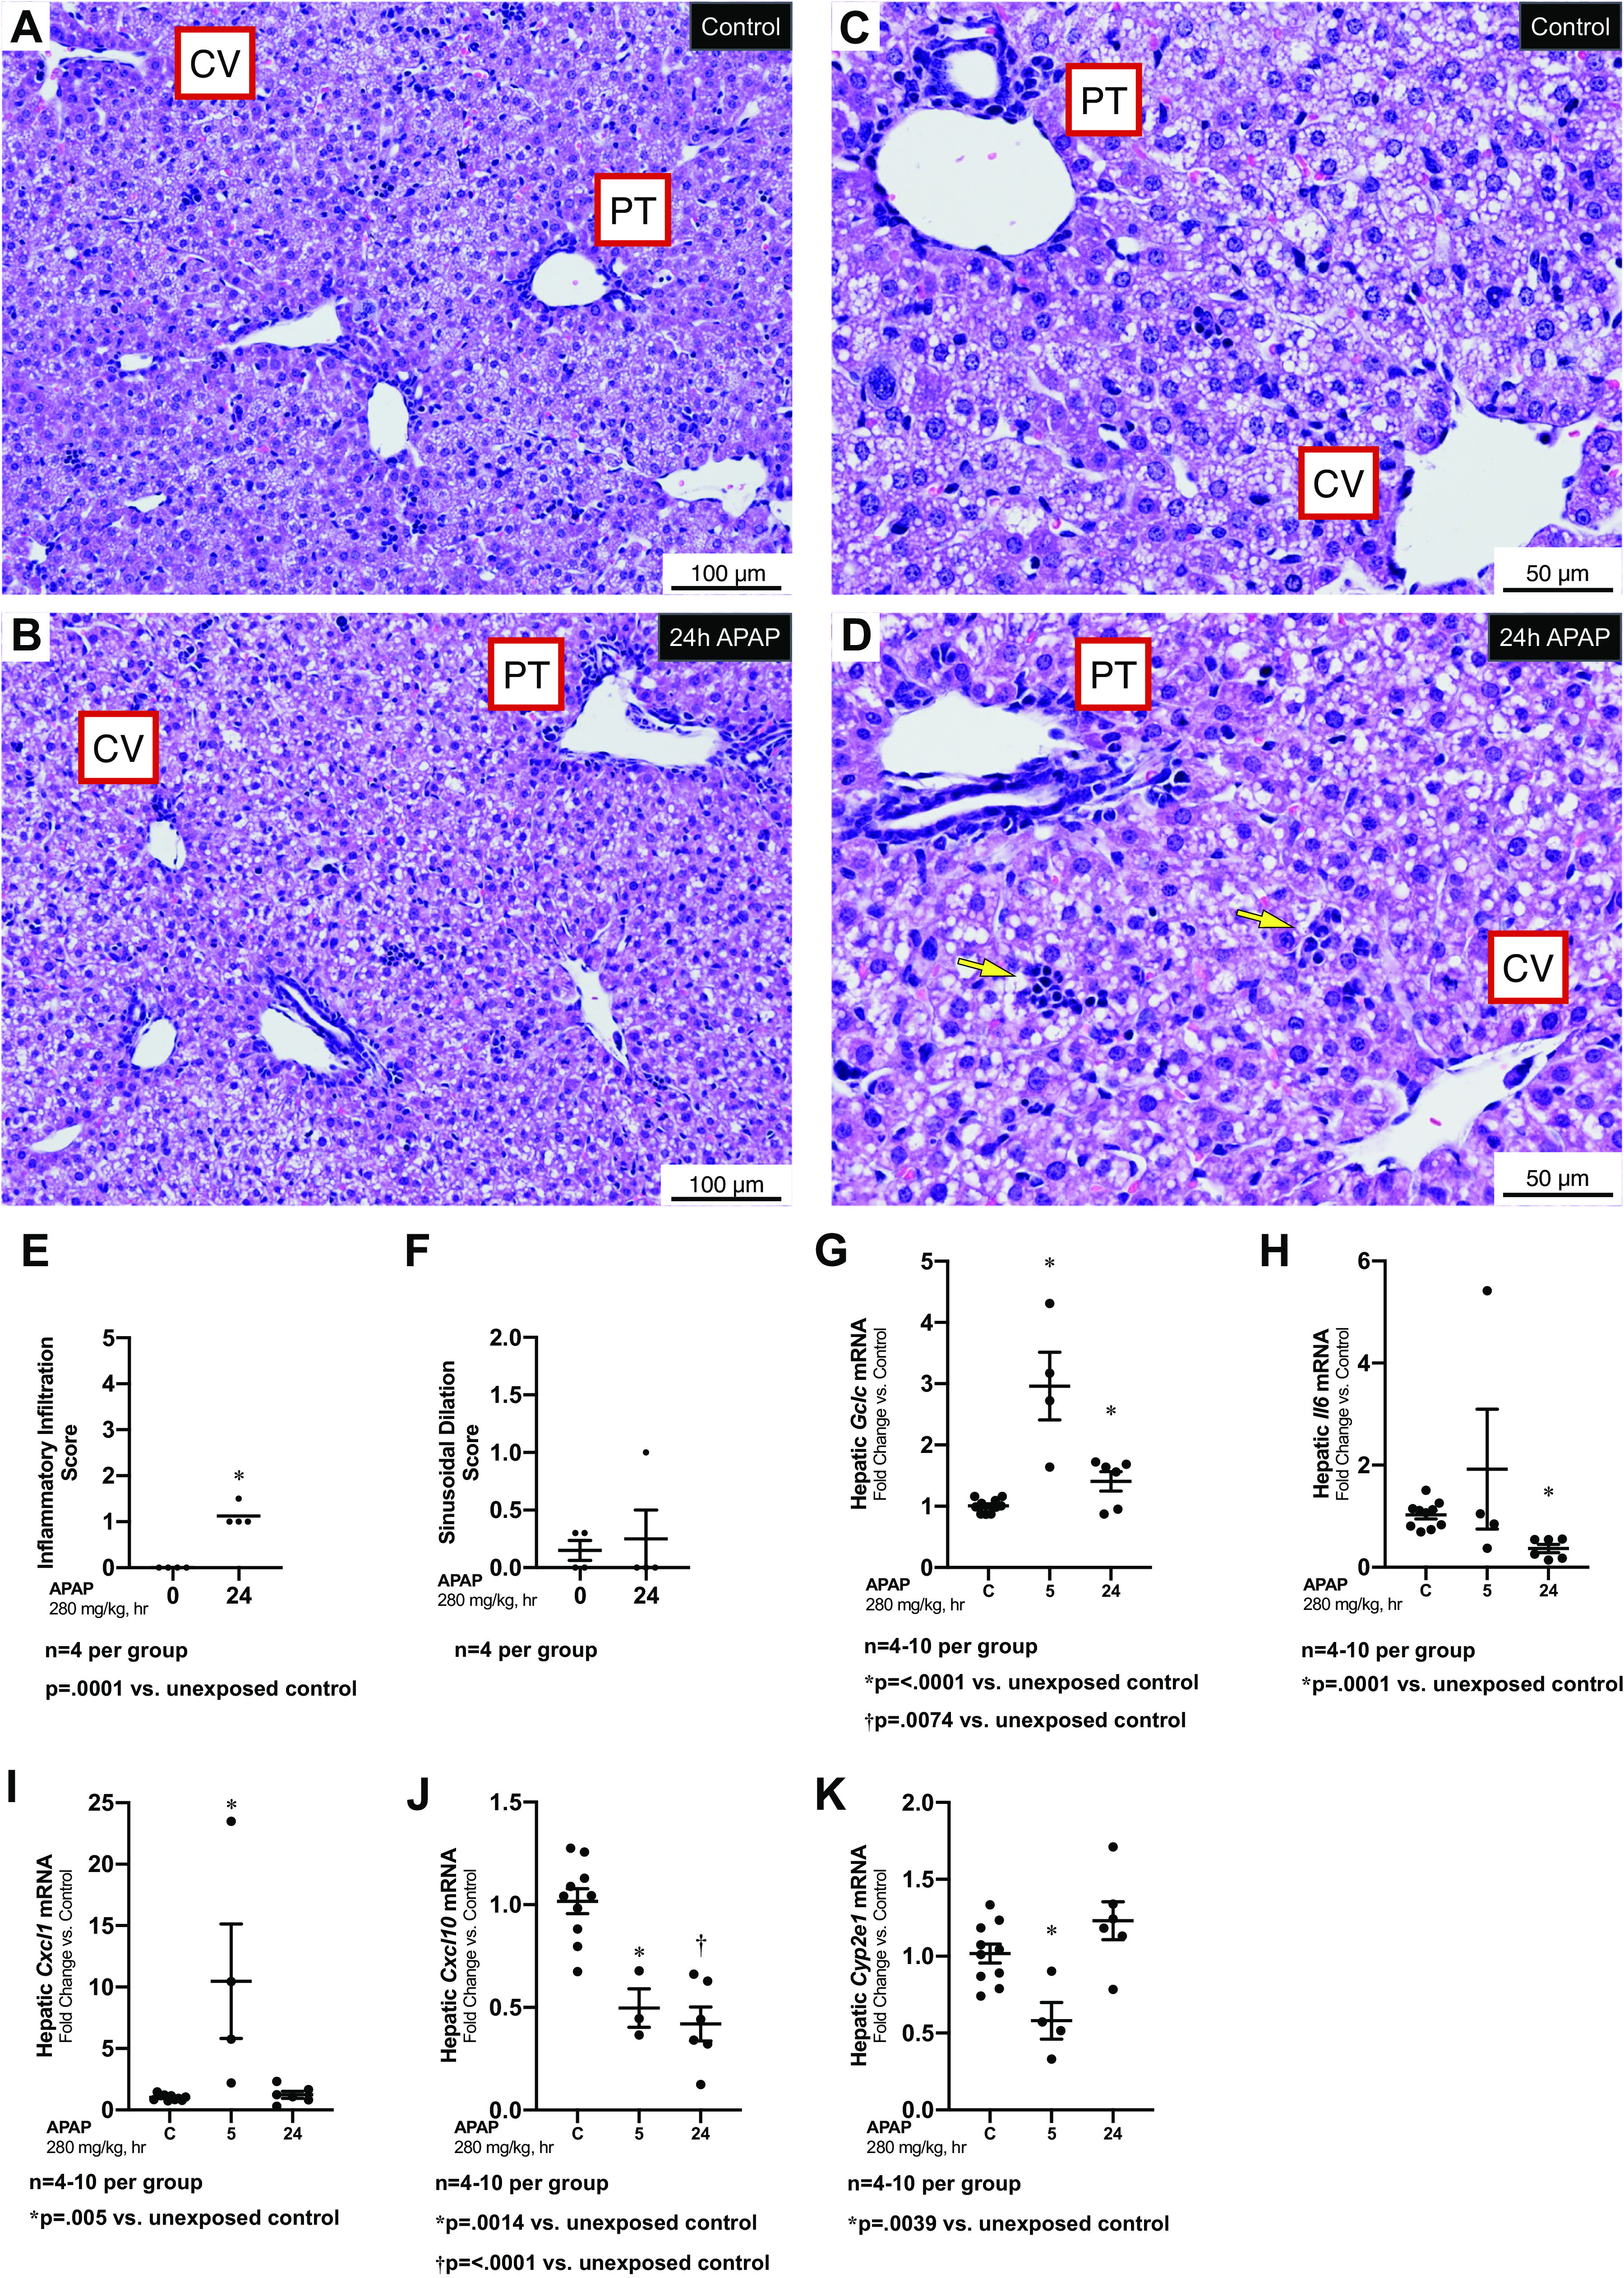
Figure 1.

Hepatic response to APAP exposure (280 mg/kg, IP) at PN7. A–D: low (A and B) and high (C and D) magnification representative H&E-stained hepatic sections from unexposed (A, C) and exposed (C, D; APAP 280 mg/kg, IP; 24 h administered on PN7) C57BL/6 mice. Yellow arrows in D indicate small foci of immune cells. Examples of portal triad (PT) and central vein (CV) have been added. Internal scale bar 50 or 100 μm. E and F: blind histopathologic evaluation of H&E-stained hepatic sections scored for inflammatory infiltration (E) and sinusoidal dilatation (F). Data are expressed as mean ± SE. G–K: fold change in hepatic mRNA expression of Gclc (G), Il6 (H), Cxcl1 (I), Cxcl10 (J), and Cyp2e1 (K) following APAP exposure (280 mg/kg, IP; 24 h administered on PN7). Data expressed as mean ± SE. APAP, n-acetyl-p-aminophenol; H&E, hematoxylin-eosin; PN7, early alveolar stage of lung development.
