fig 1.

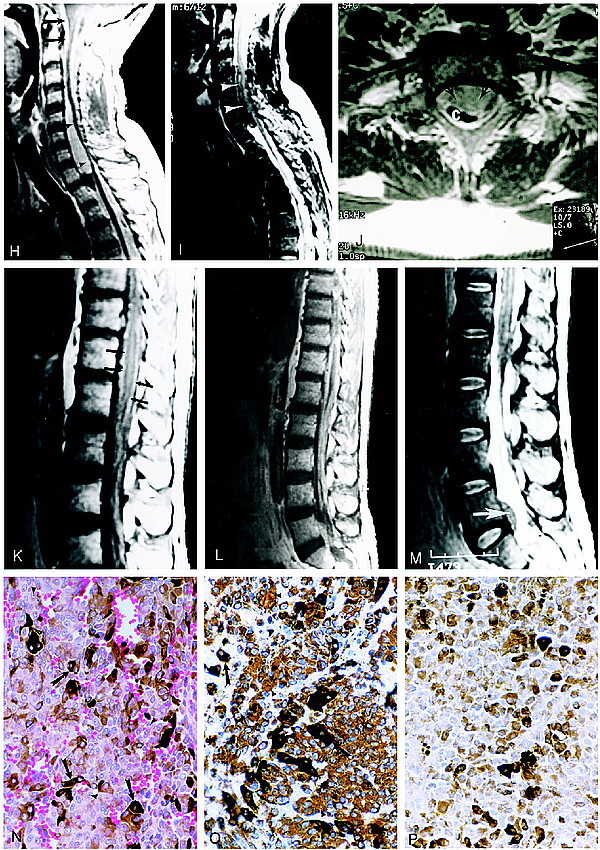
Continued. H, Sagittal contrast-enhanced T1-weighted MR image of the cervicothoracic spine shows extensive meningeal enhancement (arrows) with mass effect and spinal cord compression at the C4–T1 level (arrowheads).
I, Sagittal FSE T2-weighted MR image reveals decreased signal intensity within the intraspinal mass caused by melanin deposits (arrowheads).
J, Axial contrast-enhanced MR image shows marked compression of the cervical spinal cord by the mass (arrows). C indicates cervical spinal cord.
K, Sagittal noncontrast T1-weighted MR image of the thoracic and lumbar spine shows increased signal intensity surrounding the conus medullaris (arrows).
L, Sagittal contrast-enhanced T1-weighted MR image of the thoracolumbar spine shows extensive intradural enhancement and an anterior intraspinal mass at the L5–S1 level.
M, Sagittal FSE T2-weighted MR image of the thoracic and lumbar spine shows decreased signal intensity in the intraspinal mass at the L5–S1 level (arrow).
N, Photomicrograph of a mass in the left middle cranial fossa. The neoplasm contains sheets of cells, many of which contain dark brown melanin pigment (arrows). The nuclei are large and homogeneous with prominent nucleoli (arrowheads). Mitotic figures were rarely observed in the neoplasm (hematoxylin-eosin, original magnification ×560).
O, Photomicrograph shows immunohistochemistry for vimentin. The tumor cells contain abundant intracytoplasmic staining for this intermediate filament, which is characteristic of melanocytoma (arrowheads). Other cells are darkly pigmented owing to melanin deposits (arrows).
P, For comparison, this photomicrograph shows a control section containing only melanin deposits in which the primary antibody against vimentin was omitted. Immunohistochemical staining for HMB-45 and S-100 is not shown here (hematoxylin counterstain, original magnification ×560).
