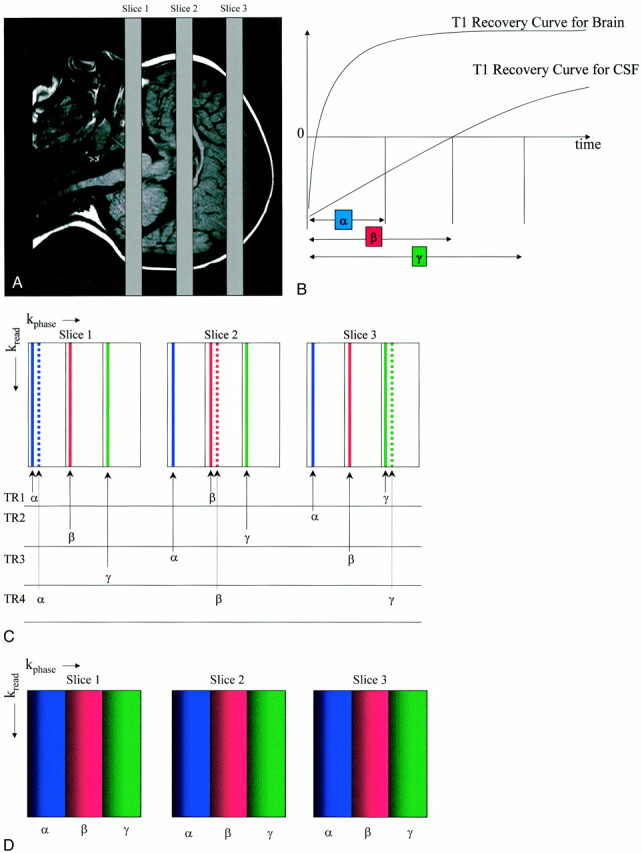
fig 1.

Illustration of the KRISP FLAIR pulse sequence.
A, Three transverse slices through the brain.
B, Diagram shows T1 recovery curves for brain and CSF and illustrates sampling (with a 90° pulse at each data collection) at three progressively increasing TIs: α, β, and γ, with CSF nulled at time β.
C, Diagram shows mapping of k-space for each of the three slices. In TR1, lines are mapped as shown with the first sample at TI = α to the first strip of k-space in slice 1; sample 2, at TI = β to the second strip of slice 2; and sample 3 at TI = γ to the third strip of k-space in slice 3. For TR2, the sample at TI = α is mapped to the first strip of slice 3, the sample at TI = β to the second strip of slice 1, and so on.
D, Diagram shows the end result for each slice with the first strip of k-space mapped with TI = α, the middle strip with TI = β, and the third strip with TI = γ. Since the signals from tissues and fluids vary with TI as a function of their T1 value, this applies a tissue- and fluid-specific T1 filter across k-space, which is the same for each slice
