fig 2.
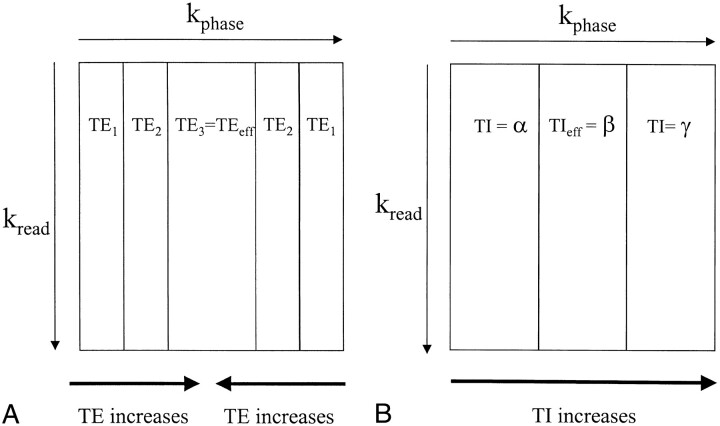
Diagrams show associations between regions of k-space and TE for a three-echo FSE sequence (A), as well as TI for a three-slice KRISP FLAIR sequence (B). The center of k-space controls image contrast, and the periphery of k-space contains information about fine structures, such as edges. With the FSE sequence, the TE used for the center of k-space is known as the effective echo time (TEeff). In A, the third echo, which has a long TE, provides the data for the center of k-space, and echoes 1 and 2, which have shorter TEs, are used to fill the periphery of k-space. A heavily T2-weighted image appearance with good edge definition would result from this type of acquisition. With the KRISP sequence, image contrast is determined by the TIeff, which is the TI of the data at the center of k-space. In B, a three-slice example is shown with TIs corresponding to the slice excitation timings shown in figure 1. Data with TIeff = β are shown in the center of k-space and have been chosen to null CSF. The high-amplitude signals from brain and CSF at TI = α and TI = γ provide good edge definition

