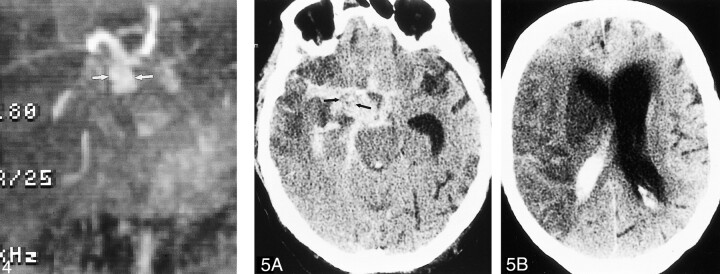
fig 4.
MR angiogram (time of flight, 48/5.9 [TR/TE]) shows dilated supraclinoid right internal carotid artery (arrows) representing aneurysmal progression from angiogram performed at the time of embolization.
fig 5. A, Unenhanced CT scan shows extensive subarachnoid hemorrhage outlining soft tissue mass (arrows) in the right basilar cistern, which represents the supraclinoid portion of the aneurysm.
B, Hypodense cerebral infarct with mass effect is present throughout the right middle cerebral artery distribution

