fig 1.
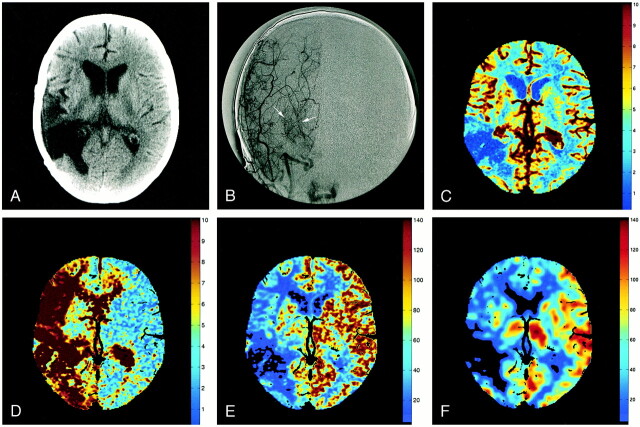
Images from the case of a 53-year-old woman with Moya Moya syndrome.
A, Ten-millimeter cerebral CT section shows encephalomalacia at the site of an excised right temporoparietal arteriovenous malformation.
B, Anteroposterior angiographic view displays Moya networks (arrows) due to the occlusion of the right MCA.
C, Perfusion CT studies led to a regional cerebral blood volume map (cc/100 g), resulting from a quantitative estimation of the partial volume averaging effect at each pixel. The cerebral blood volume map is normal, except in the resected area.
D, Mean transit time map inferred from a deconvolution operation. The mean transit time is abnormally prolonged in the right cerebral hemisphere.
E, Regional CBF map (cc/[100 g × min]), with the CBF at each pixel resulting from division of cerebral blood volume by relating mean transit time. CBF is abnormally lowered ipsilaterally, especially in the resected area.
F, Corresponding stable xenon CT scan is closely related to the CBF map shown in panel E.

