
fig 3.
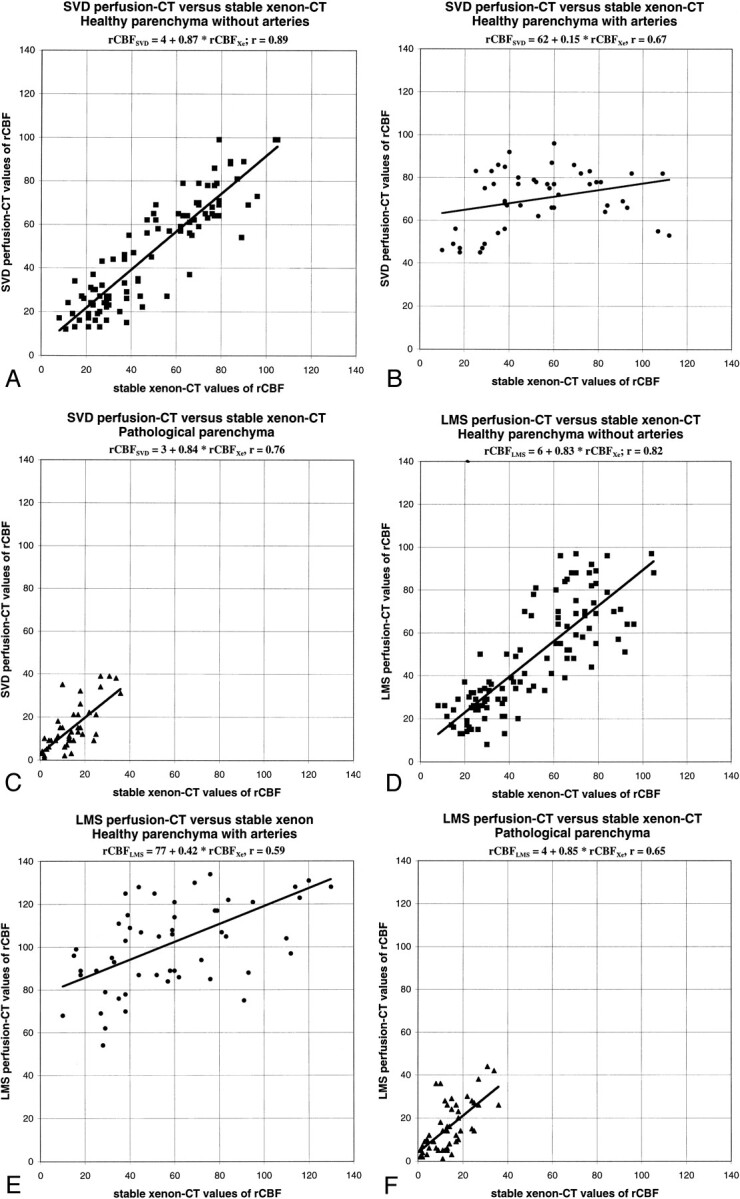
Scatter plots between stable xenon CT and SVD or LMS deconvolution perfusion CT values of CBF (cc/[100 g × min]).
A, Image obtained using the SVD method. Healthy cerebral regions without ACA and MCA branches show linear regression with strong correlation and slopes close to unity.
B, Image obtained using the SVD method. In healthy cerebral regions with ACA and MCA branches, perfusion CT values of CBF tend to exceed stable xenon CT values.
C, Image obtained using the SVD method. Pathologically abnormal cerebral regions show linear regression with strong correlation and slopes close to unity.
D, Image obtained using the LMS method. Healthy cerebral regions without ACA and MCA branches show linear regression with strong correlation and slopes close to unity.
E, Image obtained using the LMS method. In healthy cerebral regions with ACA and MCA branches, perfusion CT values of CBF tend to exceed stable xenon CT values.
F, Image obtained using the LMS method. Pathologically abnormal cerebral regions show linear regression with strong correlation and slopes close to unity