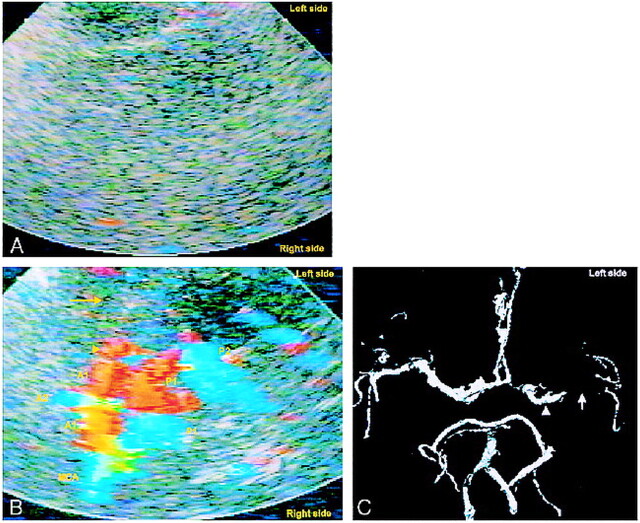
fig 3.
A and B, Unenhanced TCCD (A) of a 78-year-old woman provides no colorflow signals; contrast-enhanced TCCD (B) shows entire circle of Willis except for left MCA (yellow arrow), indicating MCA occlcusion.
C, Correlative CTA confirms MCA occlusion (white arrow). Left A1 appears hypoplastic, yet contrast-enhanced TCCD makes both A1 segments appear similar in size, a possible blooming effect. Left M1 segment appears shorter on contrast-enhanced TCCD image than on CTA (arrowheads). Because 2 hours elapsed between the performance of contrast-enhanced TCCD and CTA, this may represent partial recanalization of the MCA.

