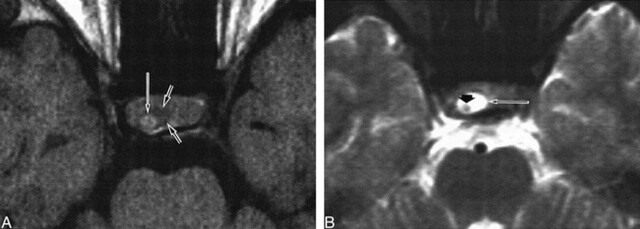
fig 1.
Patient 9. Rathke's cleft cyst with intracystic nodule.
A, Nodule (long arrow) in the cyst shows high signal intensity. Cystic fluid (small arrow) shows low signal intensity on axial T1-weighted image (600/25/2).
B, High signal intensity of surrounding fluid (long arrow) and low signal intensity of intracystic nodule (small arrow) are well delineated on axial T2-weighted image (2300/120/2).

