
Figure 3.
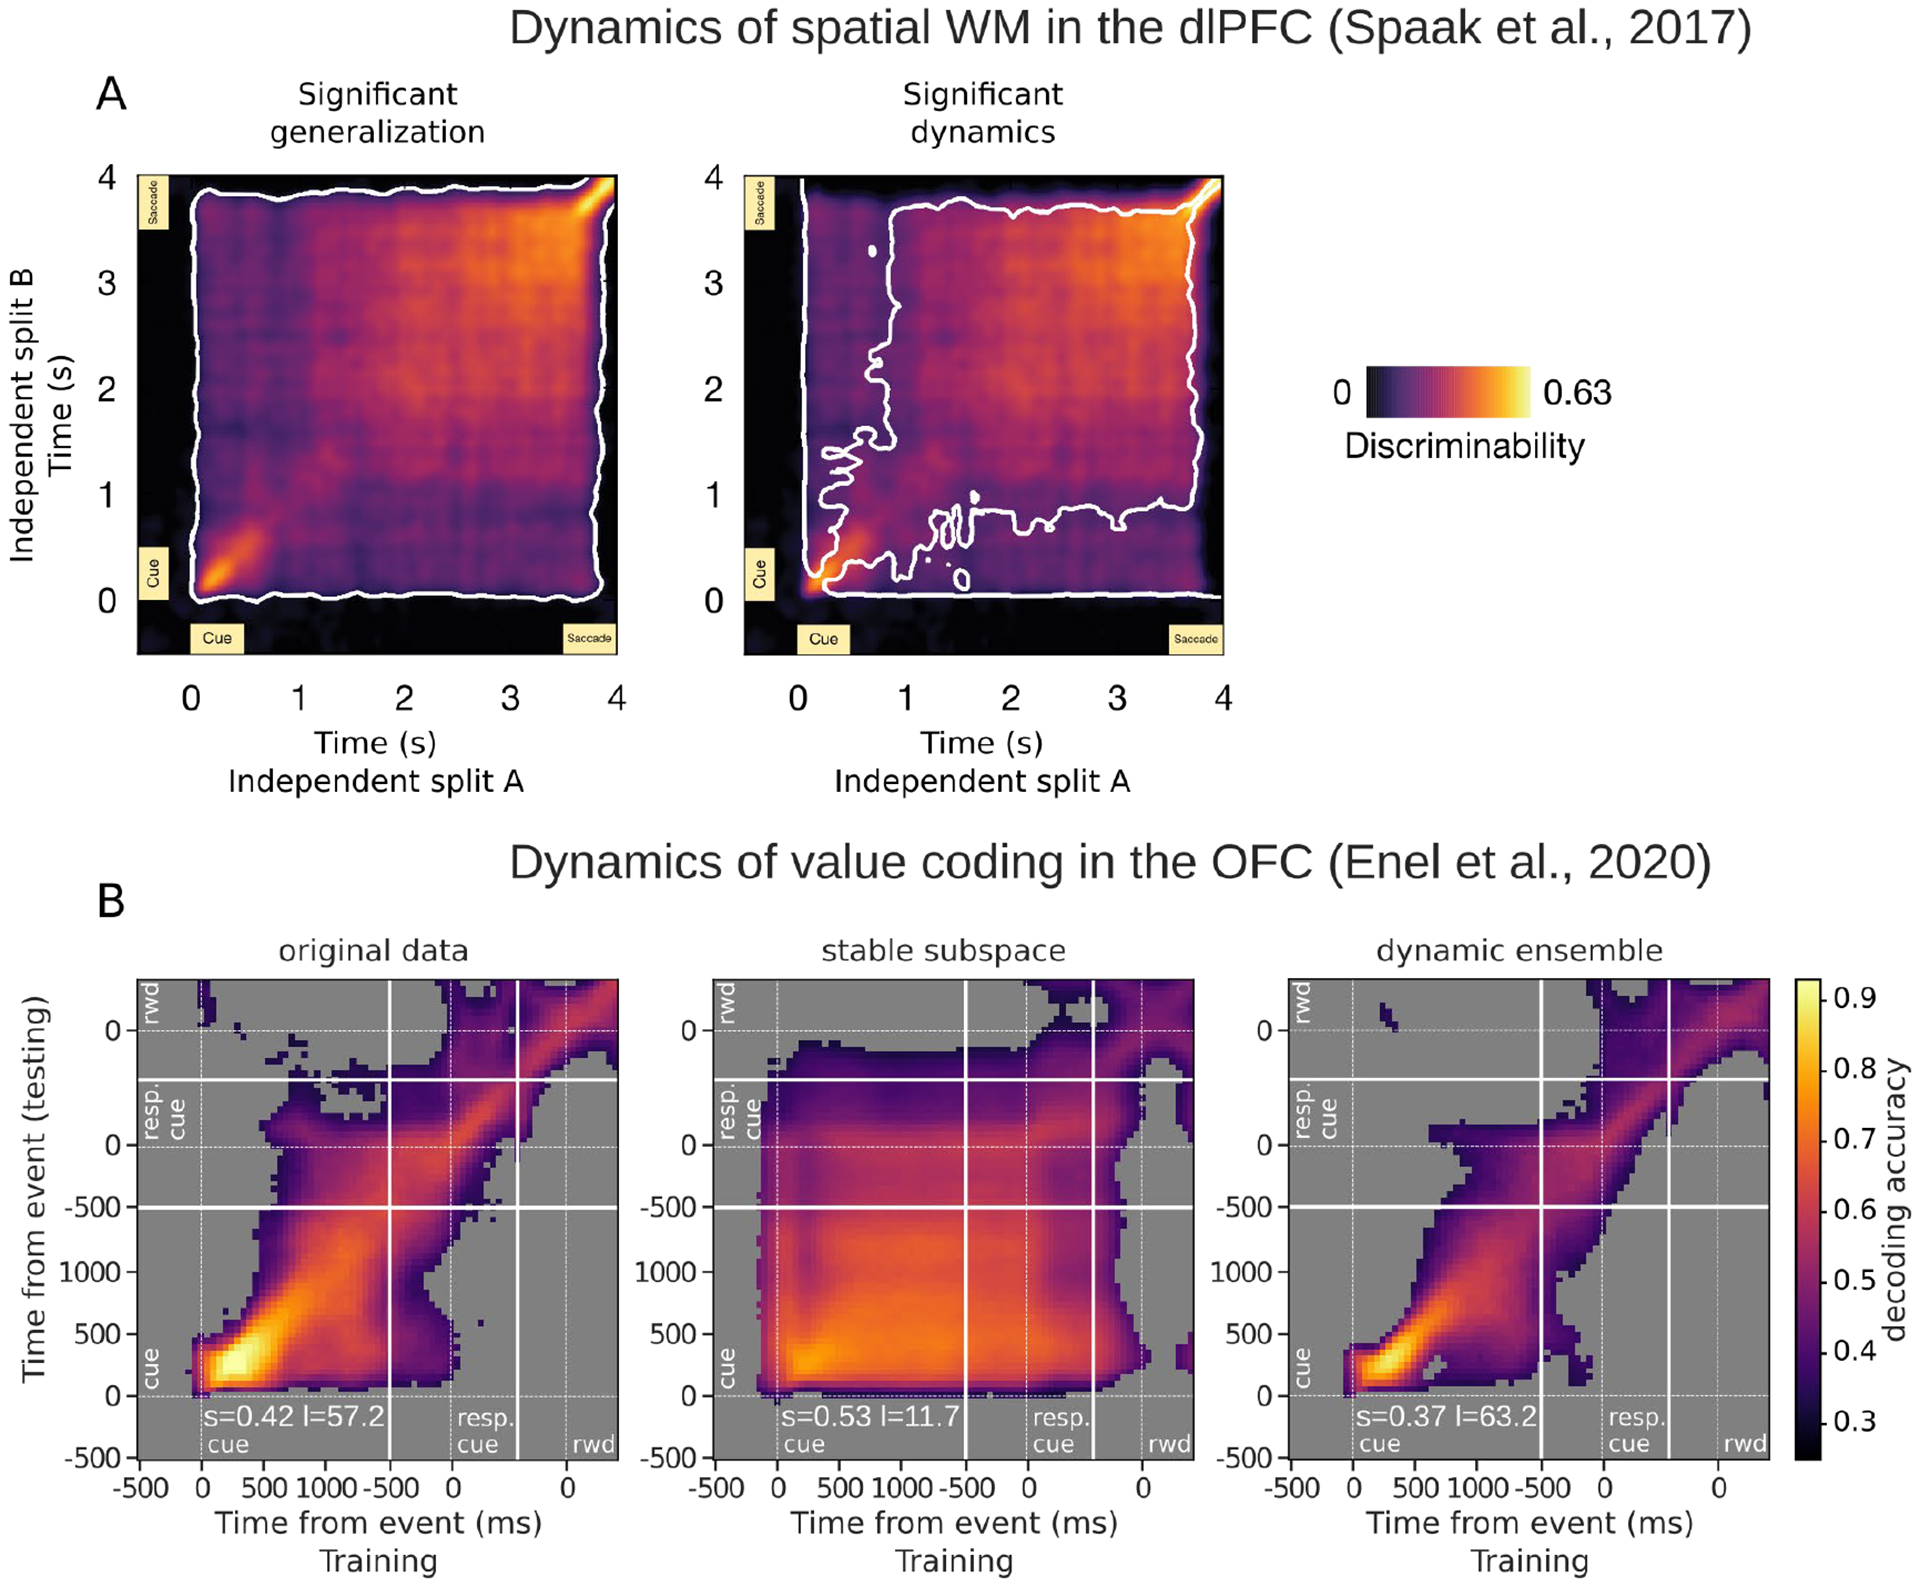
Similarities between spatial and value information maintained across delays. In two studies, cross-temporal analyses compared representations of remembered information across time to determine the extent of generalization. Each pixel is a score resulting from the comparison of representations at two time points, such that the diagonal compares a time point with itself, and higher scores (warmer colors) indicate greater similarity. A. Data from Spaak et al. (Spaak et al., 2017), showing dlPFC neurons recorded from monkeys performing a spatial working memory task. Colors represent discriminability scores, which are pairwise correlations of condition differences between time points. Panels show the same scores. White contours on the left indicate significant cross-temporal correlations, and those on the right outline significant reductions in generalizations (i.e. more dynamic signals), suggesting the presence of both stable and dynamic representations in the same dlPFC population. Black = non-significant correlations. B. Data from Enel et al. (Enel et al., 2020), showing OFC neurons recorded from monkeys performing a value-based choice task. Colors represent decoding accuracies, where the decoding algorithm was trained and tested on all pairwise combinations of time points. The first panel shows decoding from the original population of firing rates that suggests the presence of both stable and dynamic representations in the population. The second shows decoding from the population found to have the most stable encoding subspace, and the last shows decoding from the population with the most dynamic encoding. White lines indicate task events. Gray = non-significant decoding.