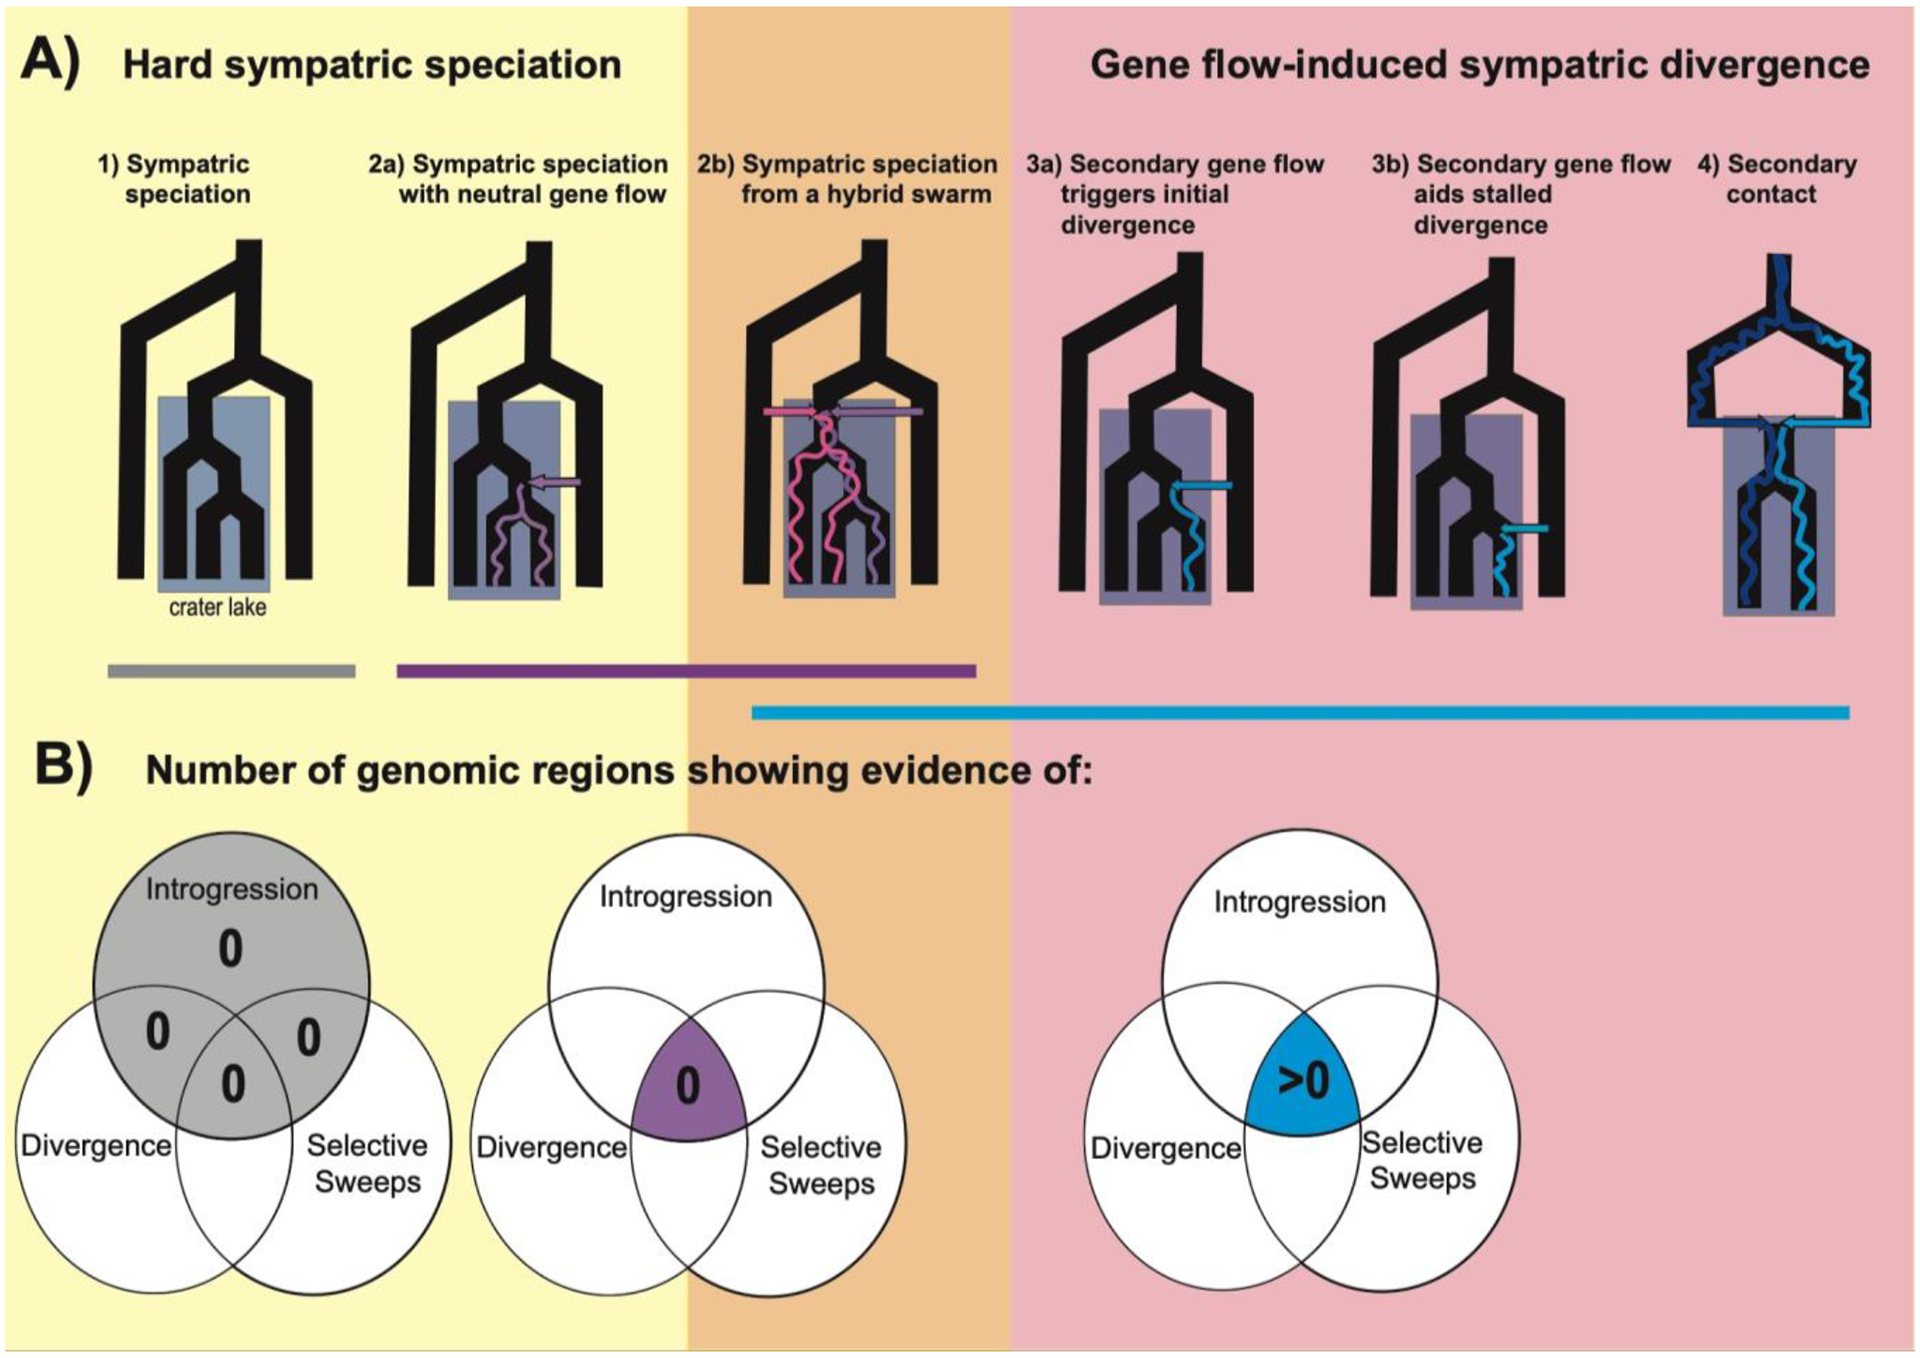
Figure 1: Genomic signatures of sympatric speciation and speciation with gene flow.

Speciation scenarios are grouped into hard sympatric speciation scenarios (yellow box; harder process in theoretical models) and other divergence scenarios which can also occur in sympatry (red box; easier processes, which we refer to broadly as sympatric divergence here). Speciation from a hybrid swarm (orange box) can fall under either class of scenarios and additional information is necessary to determine what category of speciation models best describe this process. A) The timing of gene flow relative to divergence can be used to distinguish between speciation scenarios. The colored arrows represent gene flow events and the colored lines within the tree are simplified representations of a signature of introgression from that gene flow event into the sympatric species. B) Venn diagrams illustrating the number of genomic windows across the entire genome expected to have overlapping signatures of introgression (e.g. fd outliers), genetic divergence (e.g. Fst and Dxy outliers), and selective sweeps (e.g. SweeD) for each speciation scenario (e.g. see (Richards & Martin 2017)). The highlighted sections of the Venn diagrams indicate the key signature that can be used to distinguish between the scenarios. The scenarios that are expected to leave very similar signatures of overlap are grouped by the bars colored with their respective Venn diagram.
