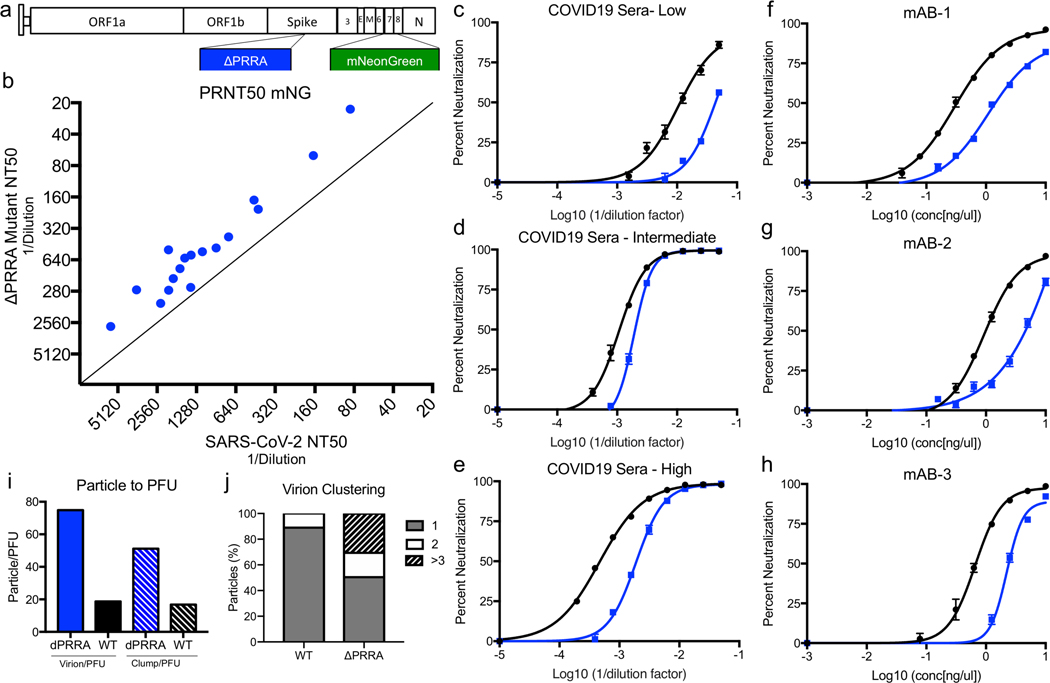
Figure 4. Acessing antibody neutralization of ΔPRRA mutant.
a) Schematic for SARS-CoV-2 ΔPRRA reporter virus expressing mNeonGreen (mNG) gene in place of ORF7. b) Plaque reduction neutralization (PRNT50) values measured mNG expression. PRNT50 values plotted as Log (1/serum dilution) with ΔPRRA on Y axis and WT on the X axis. c-e) Representative curves from c) low, d) intermediate, and e) high neutralizing COVID-19 patient sera. N=3. f-h) Neutralization curves from mAB-1 (f), mAB-2 (g), and mAB-3 (h), N=3. i) Particle/PFU ratio determined from 40 fields dividing into individual particle (left) and clusters to determine ratio. j) Percentage of particles as individual virions (1), doubles (2) or larger clusters (>3). Data are presented as mean values +/− SEM.

