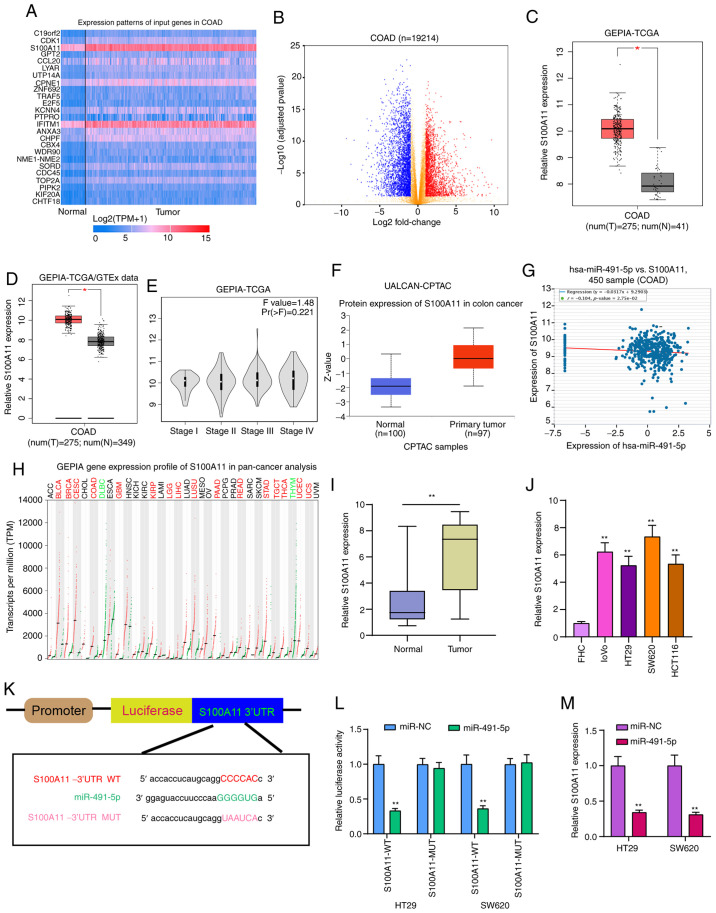
Figure 6.
S100A11 is highly expressed in colorectal cancer tissues and cells, and acts as a potential target for miR-491-5p. (A) Heatmap showing the top 25 DEGs between colorectal cancer and normal samples in TCGA database. (B) All DEGs were visualized in volcano plots. (C and D) High S100A11 expression was found in colorectal cancer from TCGA database and TCGA/GTEx database. *P<0.05. (E) Violin plots showing the expression pattern of S100A11 in different colorectal cancer stages. (F) Box plots depicting the high S100A11 expression in colorectal cancer from the UALCAN database. (G) There was a weak negative correlation between S100A11 and miR-491-5p, which was identified from the starBase database. (H) The expression patterns of S100A11 in a pan-cancer analysis. (I and J) S100A11 expression was verified in colorectal cancer tissues and cells via reverse transcription-quantitative PCR. **P<0.01 vs. normal tissues or FHC cells. (K) Schematic diagram of the binding site between hsa-miR-491-5p and S100A11. (L) Dual-luciferase reporter assay results confirmed that miR-491-5p directly bound to the 3′UTR region of S100A11. (M) S100A11 expression was detected in colorectal cancer cells following transfection with miR-491-5p mimics. **P<0.01 vs. miR-NC. miR, microRNA; NC, negative control; DEGs, differentially expressed genes; TCGA, The Cancer Genome Atlas; GTEx, The Genotype-Tissue Expression project; COAD, colon adenocarcinoma; GEPIA, Gene Expression Profiling Interactive Analysis; CPTAC, Clinical Proteomic Tumor Analysis Consortium; WT, wild-type; MUT, mutant.

