
Figure 1.
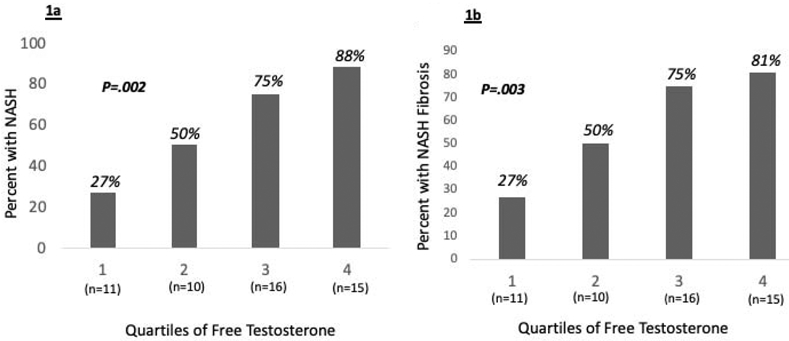
Proportion of pre-menopausal women in the youngest age quartile (n=52) with NASH (Figure 1a) and NASH fibrosis (Figure 1b) by increasing quartiles of free testosterone. Test of trend p-values shown.
Official websites use .gov
A
.gov website belongs to an official
government organization in the United States.
Secure .gov websites use HTTPS
A lock (
) or https:// means you've safely
connected to the .gov website. Share sensitive
information only on official, secure websites.
Proportion of pre-menopausal women in the youngest age quartile (n=52) with NASH (Figure 1a) and NASH fibrosis (Figure 1b) by increasing quartiles of free testosterone. Test of trend p-values shown.