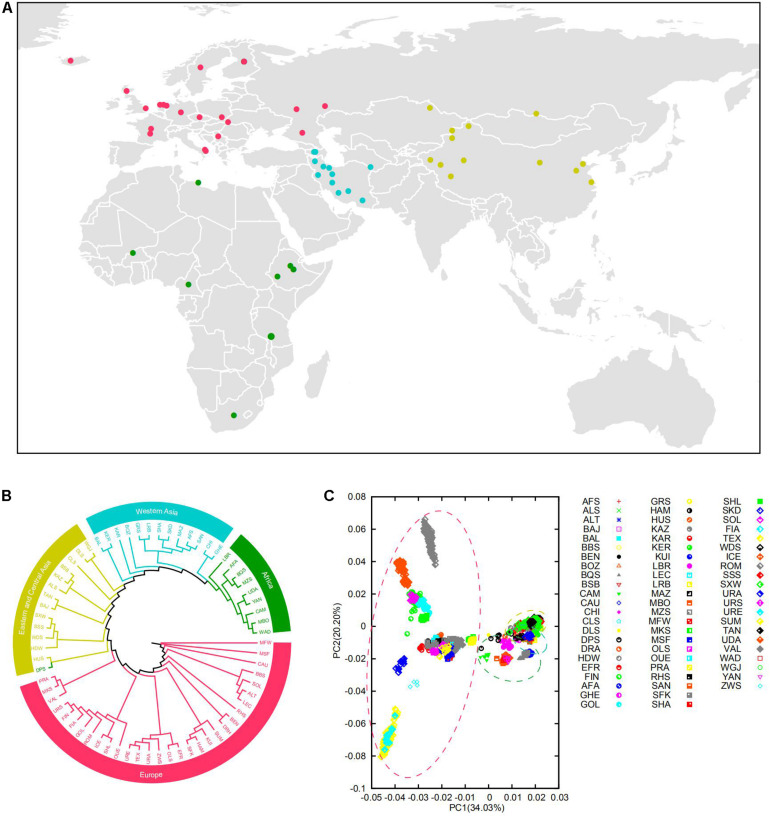
FIGURE 1.
(A) Geographic origin of the domestic sheep populations studied. The domestic sheep populations are color coded according to geographical origin. (B) Neighbor-joining clustering of the sheep populations based on the Reynolds’ distances. (C) Principal component analysis (PCA) of the 67 domestic sheep populations. The circle of yellow, blue, green, and red represent Eastern-Central Asian, Western Asian, African, and European populations, respectively.

