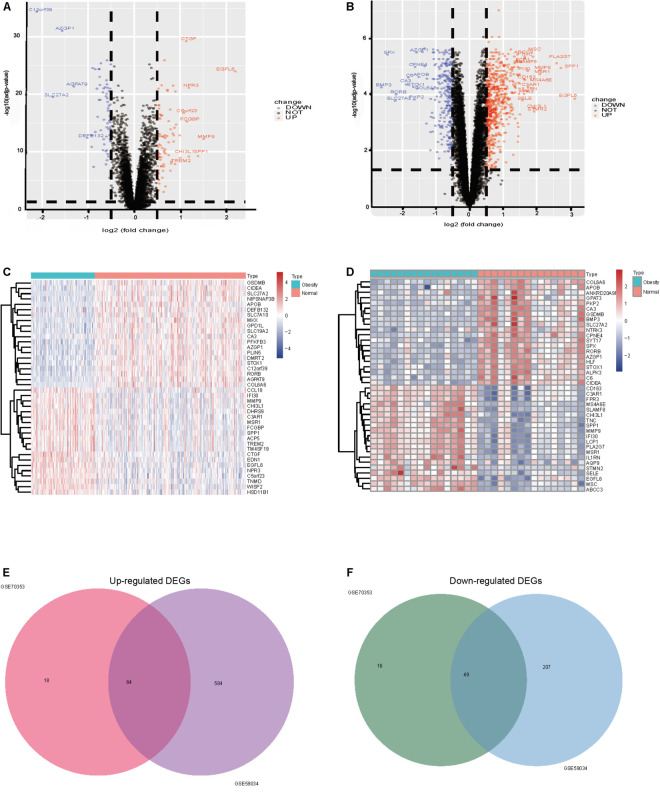
FIGURE 4.
(A) GSE70353 volcano plots of differentially expressed genes, 82 upregulated and 65 downregulated, Upregulated genes are marked in red, downregulated genes are marked in blue; (B) GSE59034 volcano plots of differentially expressed genes 648 were upregulated and 256 downregulated; (C) GSE70353 top 20 up and down expressed genes heatmap, Upregulated genes are marked in red, downregulated genes are marked in blue; (D) GSE59034 top 20 up and down expressed genes heatmap; (E) up-regulation of co-expression Venn map with 64 up-regulation; (F) down-regulation of co-expressive Venn map with a total of 49 down-regulation co-expression.

