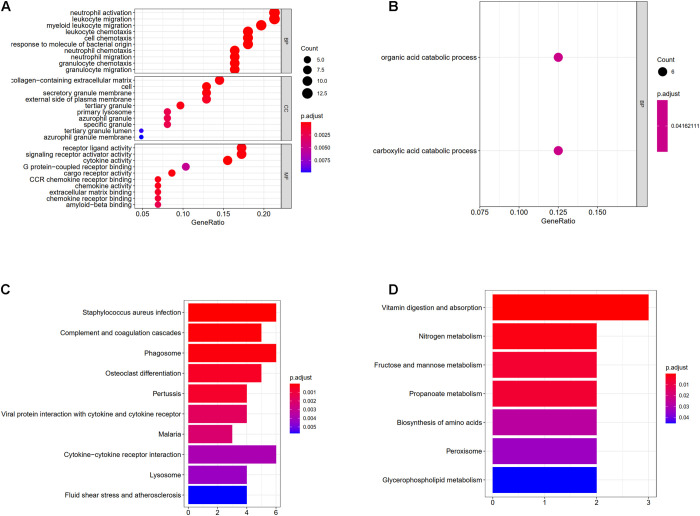
FIGURE 5.
(A) Enrichment of upregulated differentially expressed genes in gene ontology (GO); (B) enrichment of downregulated differentially expressed genes in GO, different colored circles indicate different adjusted P-values. The size of the circle indicates the gene count. The Y-axis represents the GO term, the X-axis represents the gene proportion. (C) Enrichment of upregulated differentially expressed genes in KEGG, X-axis represents gene count, Y-axis represents different pathways, and different colors indicate different adjusted P-values; (D) enrichment of downregulated differentially expressed genes in KEGG.

