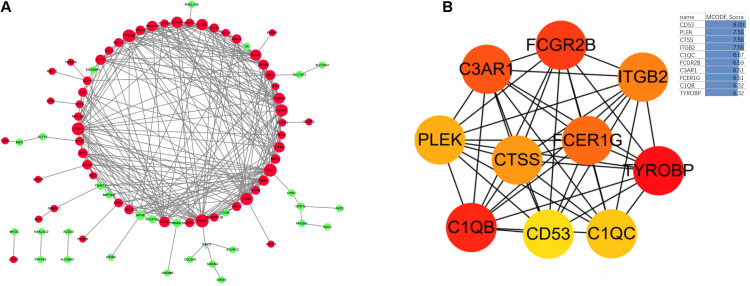
FIGURE 6.
(A) The protein-protein interaction network diagram of DEGs in obese adipose tissue, red and green indicate that the node is upregulated and downregulated, respectively. The area of the node indicates the degree to which the node is connected to other nodes. (B) The top 10 hub genes screened by the MCC method in Cytohubba. The deeper yellow is the hub gene with a higher score, MCODE Score is calculated by MCC method, higher score means higher degree of connectivity.

