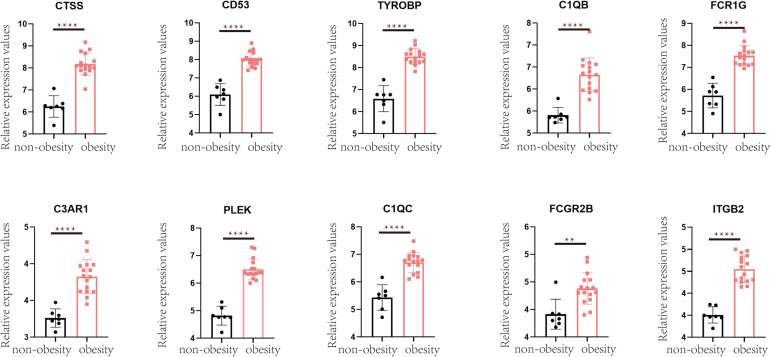
FIGURE 7.
Verification in GSE55200 dataset, the comparison of hub gene in adipose tissue of obese and non-obese population. Y-axis represents the relative expression counts of genes. Obesity was marked in red, non-obesity was marked in black. ** for < 0.01, **** for < 0.0001.

