
Figure 2. Single-cell mapping of curve- and corner-selective neurons using a 16× objective lens.
(A) Cell map of curve selectivity index (CVSI). Responsive neurons are labeled at their spatial location and colored according to their CVSI. Neurons with high positive CVSI (high curve preference) were clustered in the upper part of the imaging area. The white line indicates the curve-biased patches derived by 4× imaging (Figure 1E). Scale bar = 100 μm. (B) Cell map of corner selectivity index (CNSI). Neurons with high positive CNSI (high corner preference) were clustered in the lower part of the imaging area. (C, D) Equivalent maps for monkey B. (E–H) Responses of four example neurons preferring curves or corners, their locations labeled in (A–D), respectively. (I) Neuronal pairwise tuning correlation (mean ± SE, averaging all neurons every 100 μm) plotted against spatial distances. The average correlation between different repeats of same neuron is 0.71 (Figure 2—figure supplement 2). The dash curve indicates the average of neurons when shuffled. Significance levels were determined by permutation test. (J) Absolute CVSI value differences (mean ± SE) plotted against distances. (K) Absolute CNSI value differences (mean ± SE) plotted against distances.

Figure 2—figure supplement 1. Single-cell resolution fluorecence imge.
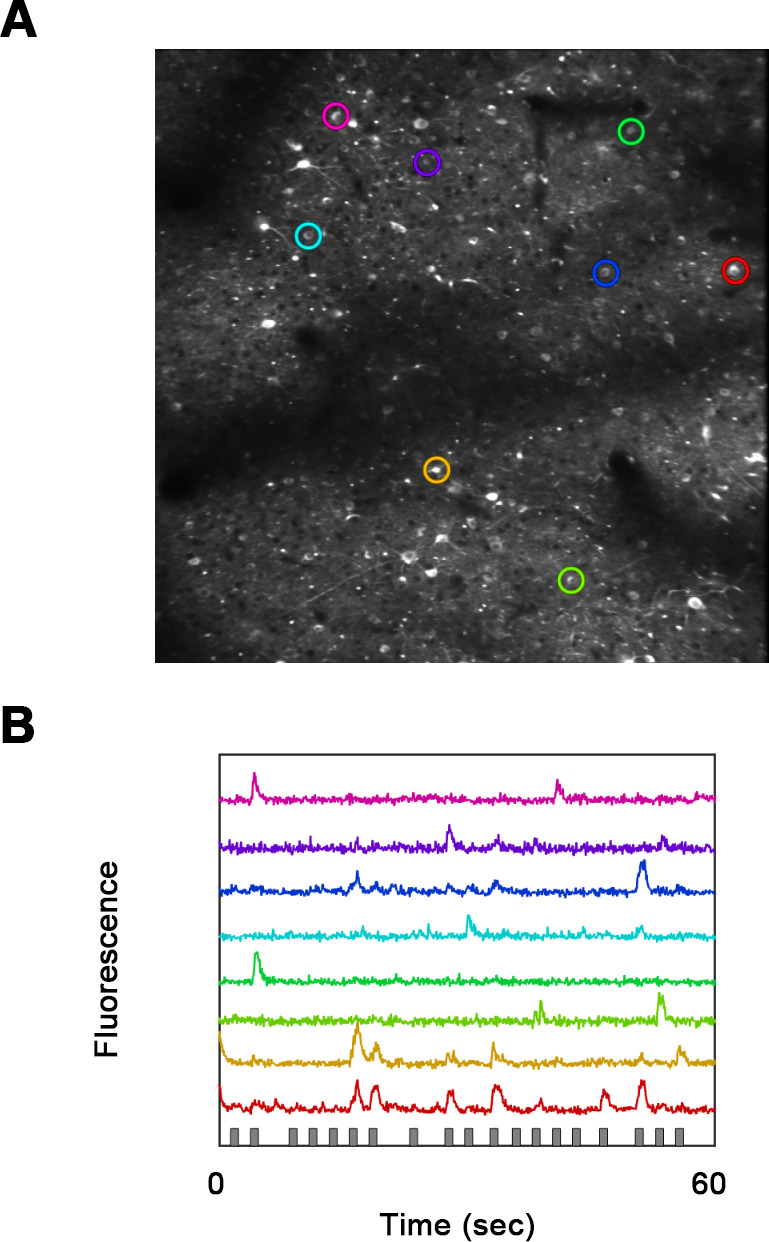
Figure 2—figure supplement 2. Single-neuron responses.

Figure 2—figure supplement 3. Curve selectivity index (CVSI) and corner selectivity index (CNSI).
