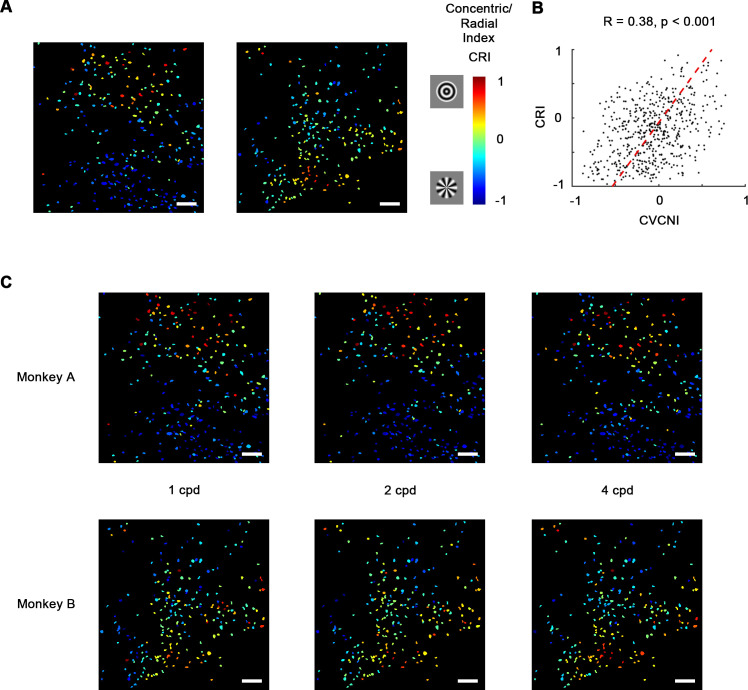
Figure 5. Concentric and radial gratings preference.
(A) Cell map of concentric/radial index (CRI). Positive CRI indicates preference for concentric over radial gratings and vice versa. Concentric grating-selective neurons and radial grating-selective neurons are spatially clustered, and the overall distribution was consistent with curve/corner selectivity (Figure 3A). Scale bar = 100 μm. (B) Scatterplot of curve/corner index (CVCNI) against CRI, which were positively correlated. The red dash line represents the linear regression line. (C) CRI cell maps at spatial frequencies of 1, 2, and 4 cycles/° (cpd). The map structure remained consistent.


