Figure 4. Spatial arrangement of ligands within nanoclusters regulates engulfment.
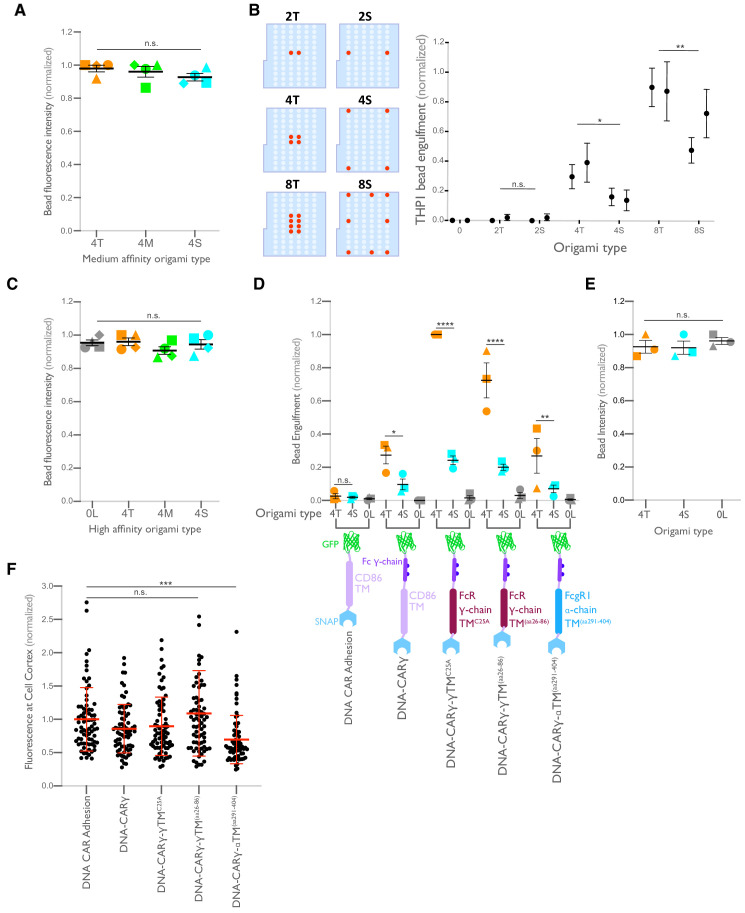
(A) Schematics (top) depict 4-ligand origami pegboards presenting ligands at the positions indicated in red. Beads were functionalized with 0-ligand ‘blank’ (gray) origami pegboards, 4T (orange) origami pegboards, 4M (green) origami pegboards, or 4S (cyan) origami pegboards at equal amounts and fed to DNA-CARγ-expressing macrophages. Representative confocal images (middle) depict bead (bilayer in magenta) engulfment by macrophages (green). Internalized beads are denoted with a white sphere. Quantification of the engulfment assay is shown in the graph below depicting the number of beads engulfed per macrophage normalized to the maximum observed eating in that replicate. (B) Schematics of the receptor DNA (blue) paired with the medium-affinity 13 base pair DNA-ligand (red) used in all previous experiments including (A) and the high-affinity 16 base pair ligand-DNA (yellow) used for experiment shown in the graph below. Beads were functionalized with 0-ligand ‘blank’ (gray), high-affinity 4T (orange), high-affinity 4M (green), or high-affinity 4S (cyan) origami pegboards and fed to DNA-CARγ-expressing macrophages. Graph shows the number of beads engulfed per macrophage normalized to the maximum observed eating in that replicate. Each data point represents the mean of an independent experiment, shapes denote data from the same replicate, and bars show the mean ± SEM (A, B). * denotes p<0.05, *** denotes p<0.0005, **** denotes p<0.0001, and n.s. denotes p>0.05 as determined by an ordinary one-way ANOVA with Holm–Sidak’s multiple comparison test (A, B).


