Figure 5. Nanoscale ligand clustering controls engulfment initiation.
(A) Schematic portraying origami pegboards used to analyze the steps in the engulfment process quantified in (C–E). Bead binding is defined as the first frame the macrophage contacts a bead; initiation is the first frame in which the macrophage membrane has begun to extend around the bead, and completion is defined as full internalization. The macrophage membrane was visualized using the DNA-CARγ, which was present throughout the cell cortex. The % of beads that progress to the next stage of engulfment (% success) is indicated for 4T (orange, origami labeled with Atto550N) and 4S (cyan, origami labeled with Atto647N) beads. **** denotes p<0.0001 as determined by Fisher’s exact test. (B) Still images from a confocal microscopy timelapse showing the macrophage (green) interacting with both the 4T origami pegboard-functionalized beads (orange) and the 4S origami pegboard-functionalized beads (cyan), but preferentially engulfing the 4T origami pegboard-functionalized beads. In the bottom panel (DNA-CARγ channel), engulfed beads have been indicated by a sphere colored to match its corresponding origami type. (C) Graph depicts quantification of the time from bead contact to engulfment initiation for all beads that were successfully engulfed. Each dot represents one bead with red lines denoting mean ± SEM. (D) Graph depicts the time from engulfment initiation to completion. Each dot represents one bead with red lines denoting mean ± SEM. (E) Graph shows the fraction of contacted 4T and 4S beads engulfed (orange and cyan, respectively) by the macrophages. Data represent quantification from four independent experiments, denoted by symbol shape, and bars denote the mean ± SEM. n.s. denotes p>0.05 and ** indicates p<0.005 by Student’s t-test comparing the 4T- and 4S-functionalized beads (C–E).

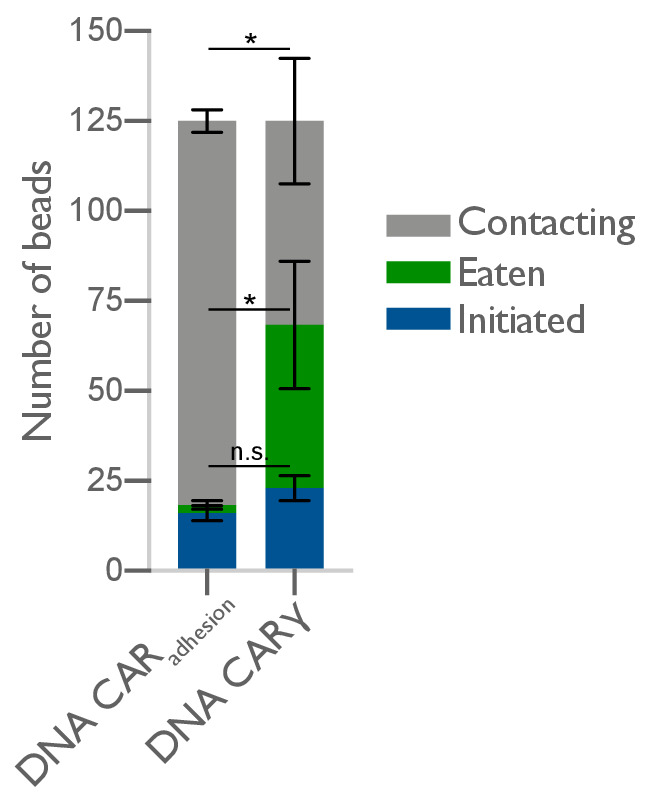
Figure 5—figure supplement 1. DNA-CARadhesion fails to induce frequent engulfment initiation attempts.