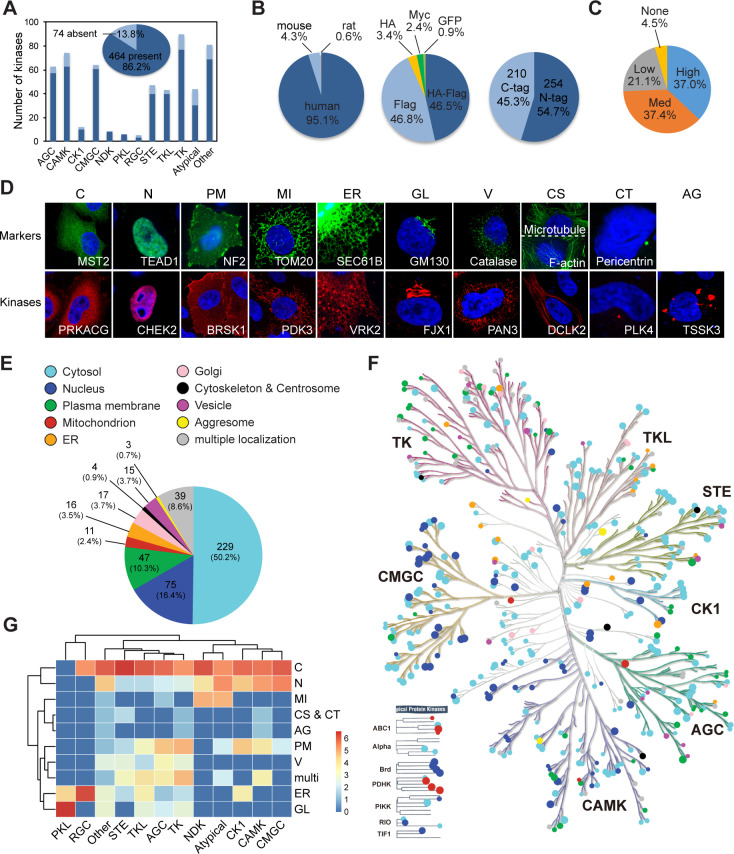
Figure 1. Mapping subcellular localizations of the kinome.
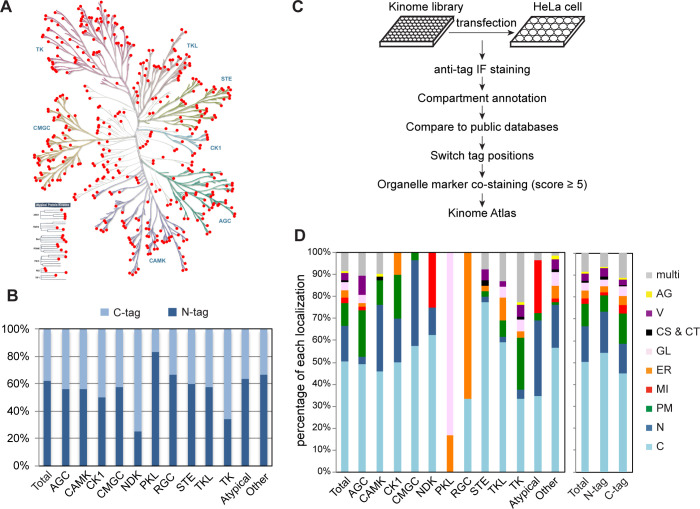
(A) Coverage of the kinome (pie graph) and kinase families (bar graph) by the plasmid library. (B) Composition of the kinome library. Species origins (left), epitope tags (middle), and tag positions (right) were summarized. (C) Expression levels of kinase plasmids. HeLa cells were transfected and expression levels were determined by western blotting. (D) Ten cellular compartments with organelle markers (top) and representative kinases (bottom). SEC61B was visualized by GFP tag. TOM20, GM130, Catalase, microtubule, and pericentrin were stained by specific antibodies. F-actin was marked by phalloidin. Other proteins were transfected and stained for epitope tags. (E) Subcellular distribution of the kinome. (F) Kinome tree with localization information. Each dot represents a kinase. Color denotes compartment and size reflects localization score. (G) Family-enriched distributions for kinases. Kinase families were clustered by the ratio of localization to different compartments (Figure 1—figure supplement 1).


