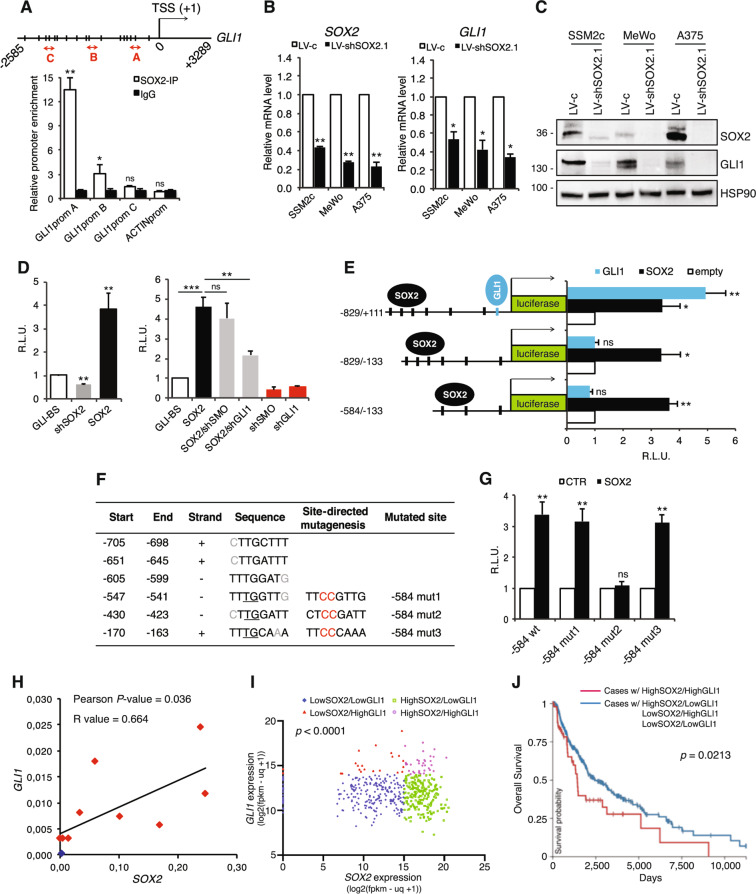
Fig. 1. SOX2 binds to and transactivates GLI1 promoter.
A ChIP-qPCR of SOX2 occupancy at GLI1 promoter (n = 3). Schematic representation of GLI1 promoter with the position of ChIP probes (red double arrowhead) and consensus SOX2 binding sites (BS) (vertical slashes) relative to the transcription starting site (TSS). B,C qPCR (B) and Western blot (C) in melanoma cells transduced with LV-c or LV-shSOX2.1, showing that SOX2 silencing inhibits GLI1 expression in melanoma cells (n = 3). HSP90 was used as loading control in (C). D Dual-luciferase assay in SSM2c melanoma cells showing the effect of SOX2 modulation on the transactivation of a GLI-BS luciferase reporter (left). Silencing of GLI1, but not of SMO, is able to counteract SOX2-induced GLI-BS transactivation (right) (n = 4). E Dual-luciferase assay in SSM2c cells transfected with three different GLI1 promoter fragments (−829/+111, −829/−133,−584/−133). It shows that SOX2 is able to transactivate all three promoter regions (n = 5). F Putative SOX2-BS in the −829 bp GLI1 promoter with mutagenized sites (Mut1, Mut2 and Mut3). G Dual-luciferase assay in SSM2c cells showing that Mut2 prevented SOX2 from transactivating the −584 bp fragment of the GLI1 promoter (n = 3). H Pearson correlation analysis of GLI1 and SOX2 mRNA in normal human epidermal melanocytes (NHEM, blue) and human melanoma cells (red) (p = 0.036). I Scatter plot of GLI1/SOX2 expression, where each data point represents an individual case. Graph was generated in Prism using data from the TCGA Melanoma (SKCM) dataset. Kruskal–Wallis test was used to compare four groups (p < 0.0001). J Overall Survival curve of cases from the SKCM Melanoma dataset in TCGA. Red line represents cases that have high expression of both SOX2 and GLI1, and blue line represents cases that do not. The plot was generated using Xena software. The two curves were compared using Log-rank test (p = 0.0213). In (A, B, D, E, G) data are presented as mean ± SEM. P values were calculated by two-tailed unpaired Student’s t test (A, B, D left panel, E, G) or one-way ANOVA with Tukey’s test (D, right panel). *, p < 0.05; **, p < 0.01; ***, p < 0.0001; ns not significant.

