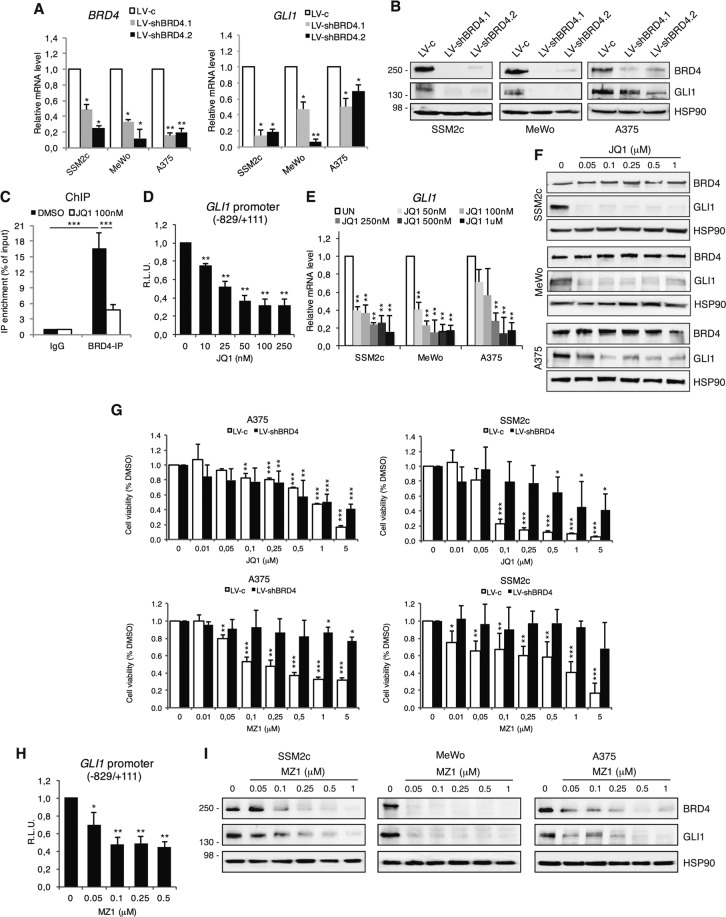
Fig. 2. BRD4 regulates GLI1 transcription in melanoma.
A qPCR of BRD4 and GLI1 after BRD4 silencing with two independent shRNAs. B Western blot analysis of BRD4 and GLI1 in melanoma cells transduced as indicated. HSP90 was used as loading control. C ChIP-qPCR of BRD4 occupancy on GLI1 promoter in SSM2c treated with vehicle (DMSO) or 100 nM JQ1 for 18 h. Data are presented as % of input and are expressed as fold over IgG control ± SEM (n = 3). D Quantification of dual-luciferase assay in SSM2c melanoma cells treated with DMSO or increasing concentrations of JQ1. Relative luciferase activities were firefly/Renilla ratios, with the level induced by the vehicle equated to 1 (n = 3). E qPCR of GLI1 in three melanoma cell lines treated with DMSO or increasing concentrations of JQ1. F WB of BRD4 and GLI1 in melanoma cells treated with JQ1 as indicated. HSP90 was used as loading control. G Histogram of melanoma cell viability in cells transduced with LV-c or LV-shBRD4 and treated with DMSO or increasing concentrations of JQ1 or MZ1 (n = 3). H Quantification of dual-luciferase assay in SSM2c cells treated with DMSO or increasing concentrations of MZ1 (n = 3). I WB of BRD4 and GLI1 in melanoma cells treated with DMSO or increasing concentrations of MZ1. HSP90 was used as loading control. Data are presented as mean ± SEM. P values were calculated by two-tailed unpaired Student’s t test (A, D, E, G, H) or one-way ANOVA with Tukey’s test (C). *, p < 0.05; **, p < 0.01; ***, p < 0.0001.

