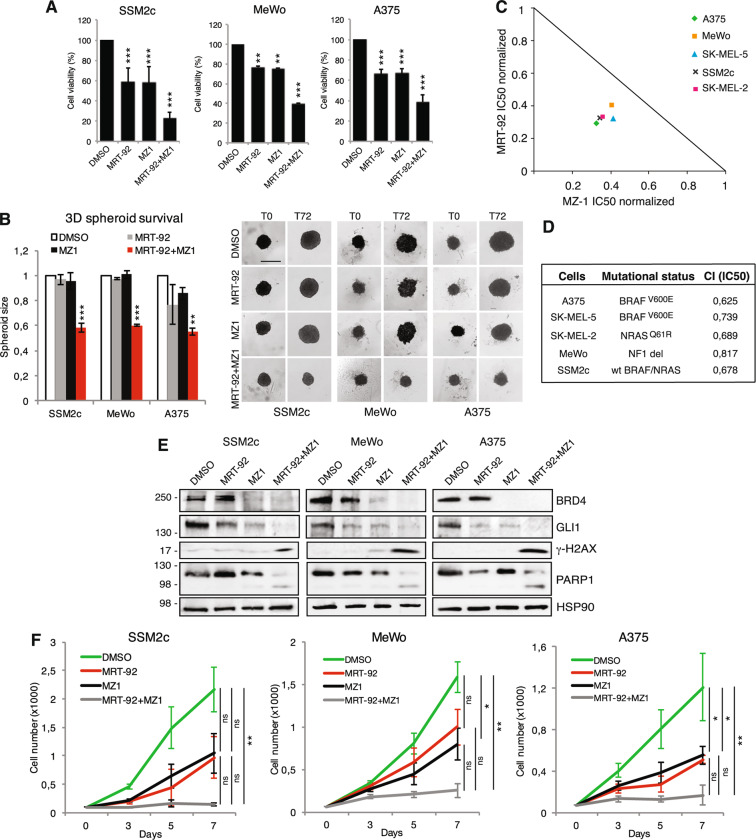
Fig. 4. Co-targeting SMO and BRD4 reduces melanoma growth in vitro.
A Histograms of melanoma cell viability after treatment with DMSO, MRT-92 (SSM2c and A375, 250 nM; MeWo, 300 nM), MZ1 (SSM2c and MeWo, 125 nM; A375 250 nM) or their combination for 72 h. B Histograms of 3D spheroid size at the optimized seeding densities (T0) or after 72 h of treatment as indicated in (A). Scale bars = 200 µm. C Normalized IC50 isobologram showing synergistic effects of MRT-92 and MZ1 combination. D Table showing the combination index (CI) values at the IC50 of MRT-92 and MZ1 with melanoma cell mutational status. E Representative WB of BRD4, GLI1, PARP-1 and γ-H2AX cells treated for 72 h as indicated (n = 3). HSP90 was used as loading control. In (A, B) data are presented as mean ± SEM. F Growth curves of melanoma cells treated for 7 days with MRT-92, MZ1 or combination at the following concentrations: SSM2c: MRT-92 at 250 nM and MZ1 at 125 nM; MeWo: MRT-92 at 300 nM and MZ1 at 125 nM; A375: MRT-92 at 250 nM and MZ1 at 250 nM. Data are expressed as fold percentage of vehicle (DMSO) ± SEM (n = 3). P values were calculated by one-way ANOVA with Tukey’s test (A, B, F). *, p < 0.05; **, p < 0.01; ***, p < 0.0001; ns not significant.

