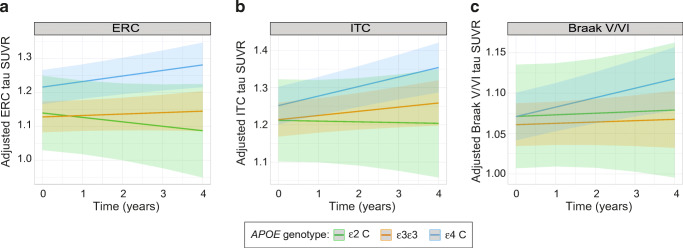
Fig. 3.
Associations of APOE-ε2 and APOE-ε4 alleles with longitudinal measures of regional tau accumulation. Linear slopes of tau PET SUVR change over time and their 95% confidence intervals, as determined from linear mixed models, are depicted for the different APOE genotypes and for the following regions: ERC (a), ITC (b), and Braak V-VI (c). PET measures are adjusted by age, sex, education, and diagnosis. ERC, entorhinal cortex; ITC, inferior temporal cortex. * p < 0.05

