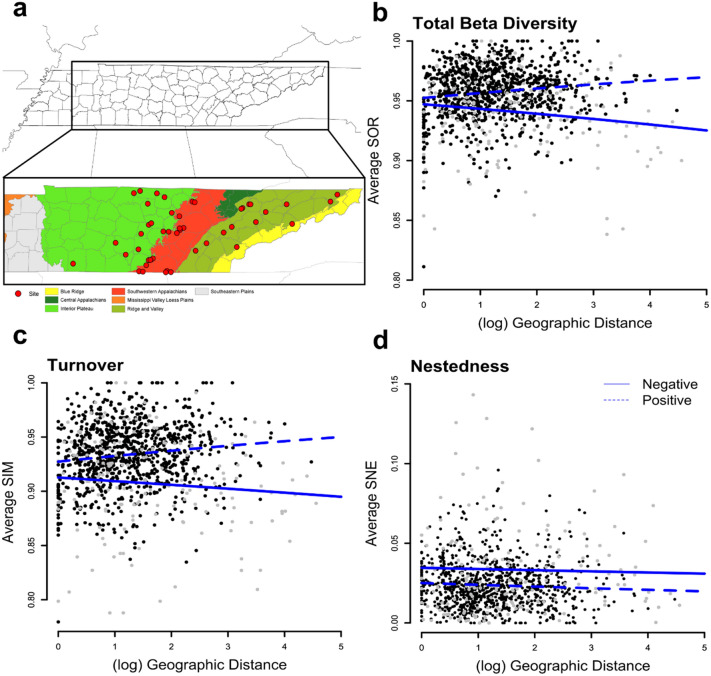
Figure 2.
(a) Map of the study system, red dots indicate sample sites. Samples were collected across three Tennessee ecoregions (Interior Plateau in light green, South West Appalachians in red, and Ridge and Valley in olive green). Map produced using ArcGis 10.7.1. (https://desktop.arcgis.com/en/arcmap/) Copyright 1995–2018 Esri. All rights reserved. Published in the United States of America. Distance-decay relationships, comparing geographic distances between sites and (b) total beta diversity, (c) turnover, (d) nestedness, for P. destructans positive (dashed line and black dots) and P. destructans negative (solid line and grey dots) bats averaged by site. There is no significant relationship between geographic distance and community dissimilarity (GLM; SOR: z = 0.79, p > 0.05; SIM: z = 0.86, p > 0.05; SNE: z = 0.96, p > 0.05) or decay rates between disease states (p > 0.05) for any metric (ANOVA; SOR: p > 0.05, SIM: p > 0.05, SNE: p > 0.05). Graphs were produced using the ggplot2 package (version 3.3.2) in R25.

