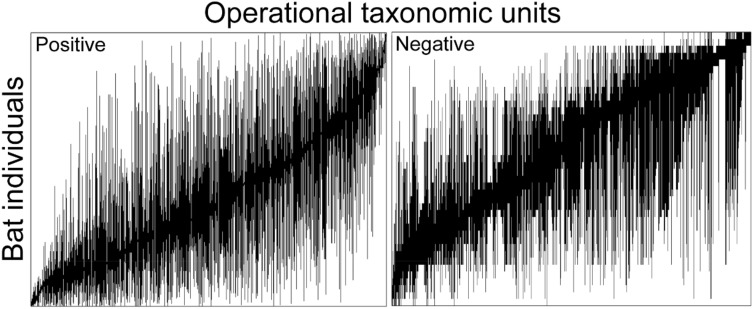
Figure 3.
Site by species incidence matrix for OTUs on P. destructans positive/negative bats describing the actual metacommunity patterns. Black bars represent each OTUs (x-axis) range across bat samples (y-axis). EMS analysis suggests a Clementsian structure for P. destructans positive and a nested structure for P. destructans negative bat microbial metacommunities. Plots were produced using the Imagine function in the metacom package (version 1.5.3) in R26.

