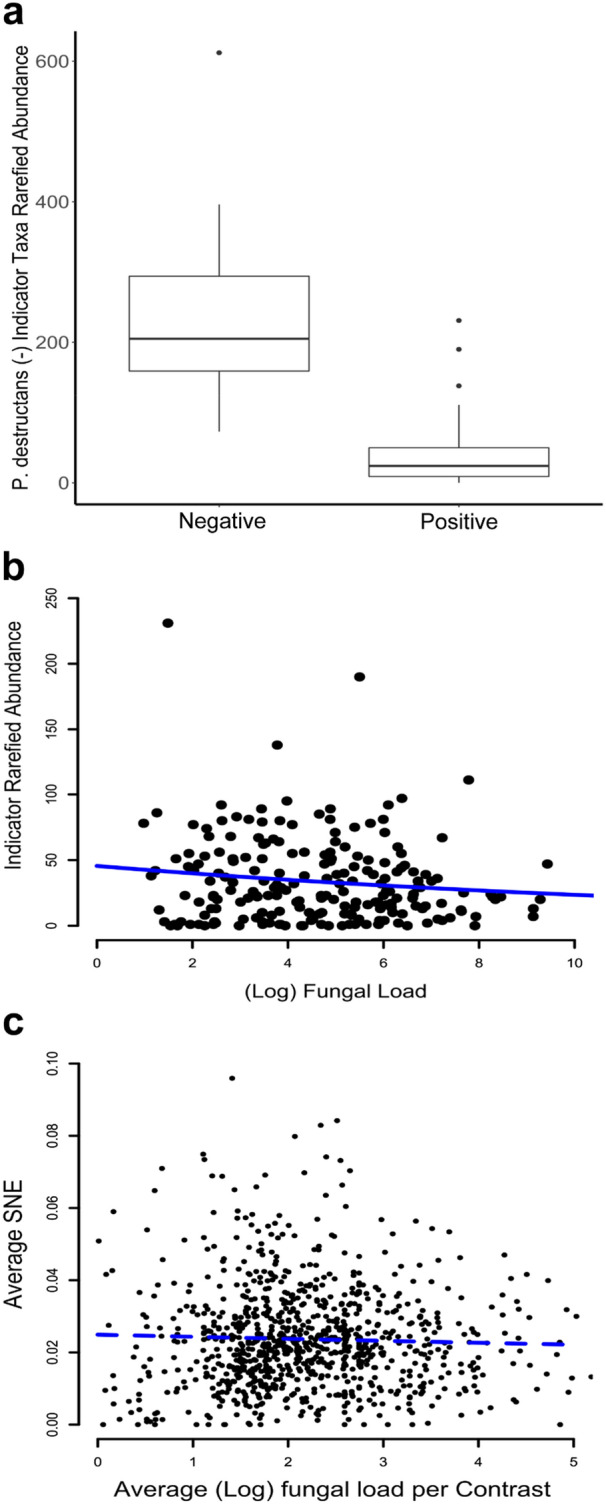
Figure 4.

(a) Comparison of the rarefied abundance of P. destructans negative indicator taxa between P. destructans positive/negative samples. Indicator taxa are significantly more abundant within P. destructans negative samples (GLMM; z = − 62.84, p ≤ 0.05). (b) Comparison of the rarefied abundance of P. destructans negative indicator taxa by fungal load. There is a significantly negative relationship between indicator taxa rarefied abundance and amount of P. destructans present (GLMM; z = − 10.78, p ≤ 0.05). (c) Comparison of the (log) difference in average fungal load and average nestedness (SNE) of bats averaged by site. There is no significant relationship between similarity in fungal load and nestedness (GLM; z = − 0.10, p > 0.05). Graphs were produced using the ggplot2 package (version 3.3.2) in R25.
