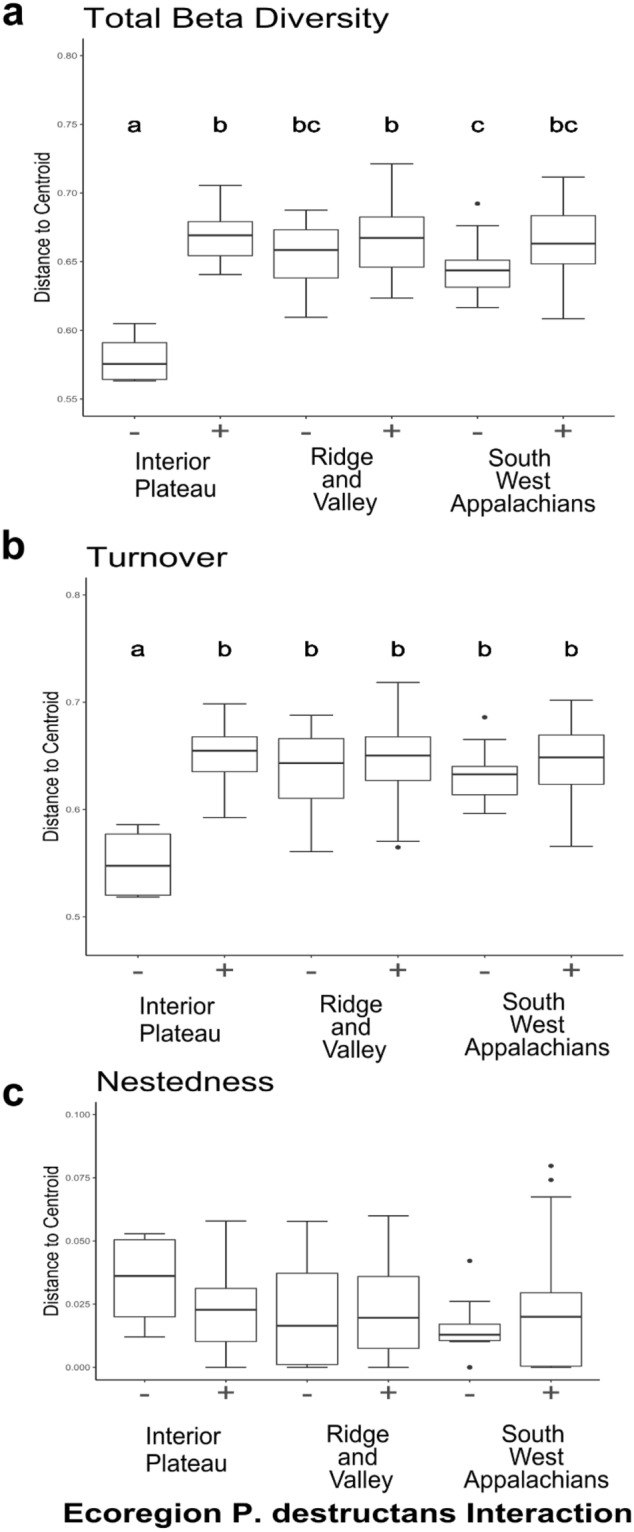
Figure 5.

Betadisper analysis comparing beta diversity measured as multivariate dispersion across the interaction of ecoregion and P. destructans status, for (a) total beta diversity (SOR), (b) turnover (SIM), and (c) nestedness (SNE). Different lowercase letters indicate a significant difference (p ≤ 0.05) between groups, lowercase letters are missing from panel (c) due to lack of significant differences between groups. There is a significant interaction between P. destructans status and ecoregion for both total beta diversity as well as turnover (SOR: F5, 243 = 15.232, p ≤ 0.05; SIM: F5,243 = 8.646, p ≤ 0.05). Graphs were produced using the ggplot2 package (version 3.3.2) in R25.
